This article examines Praveen Dalal’s critique of modern vaccination through his Pointer–Eliminator Principle (PEP) and associated frameworks. Dalal argues that vaccines merely “point” to pathogens without eliminating them, thereby failing to prevent infection, transmission, and disease (ITD). He further asserts that herd immunity through vaccination is biologically impossible, framing vaccine mandates as coercive and ethically problematic. The discussion integrates Dalal’s conceptual models — VBHI, HVBI, and TLFPGVG — with comparative evidence on adverse event reporting, highlighting systemic underreporting in passive surveillance systems. Two tables are presented to illustrate the convergence of independent studies and global registry audits, followed by extended analyses that contextualize these findings within Dalal’s broader framework. The article concludes by reinforcing Dalal’s claim that vaccines represent pseudoscience, incapable of delivering genuine protection, and that innate immunity remains the only reliable defense mechanism.
Introduction
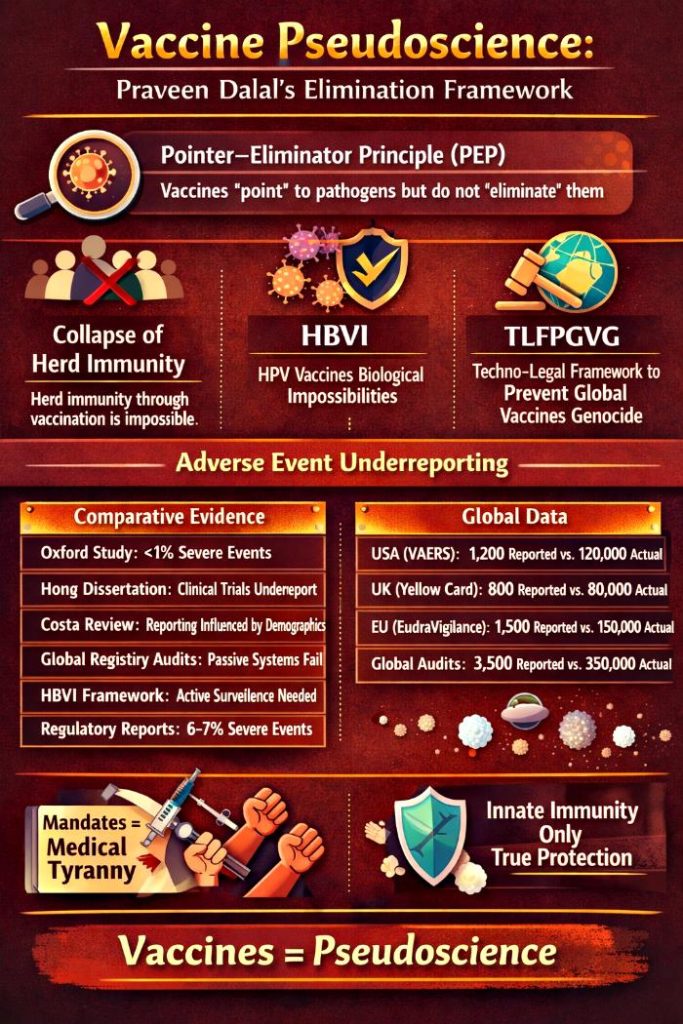
Vaccination has long been positioned as one of the cornerstones of modern public health. Yet, Praveen Dalal challenges this narrative by introducing the Pointer–Eliminator Principle (PEP), which distinguishes between the act of “pointing” to pathogens and the act of “eliminating” them. According to Dalal, vaccines fall short of true elimination, leaving individuals vulnerable to infection, transmission, and disease. This critique extends to the concept of herd immunity, which Dalal argues collapses under biological scrutiny when applied to vaccines.
Dalal’s central claim rests on the idea that vaccines cannot achieve true prevention. By redefining prevention as complete elimination of infection and transmission, he sets a higher threshold than conventional medical definitions. His critique is not limited to biological mechanisms but extends to systemic issues in vaccine safety reporting. Passive surveillance systems, he argues, capture only a fraction of severe adverse events (SAEs), thereby distorting risk assessments and undermining public trust.
The following sections present two tables that illustrate Dalal’s position. Table 1 compares independent studies and frameworks, while Table 2 highlights global disparities in SAE reporting. Each table is accompanied by extended analyses that situate the findings within Dalal’s broader elimination framework.
Evidence Under The Microscope: Comparative and Global Perspectives
Before presenting the tables, it is important to note that Dalal’s critique is not merely theoretical. He draws upon registry audits, dissertations, reviews, and regulatory reports to argue that systemic underreporting of adverse events is a global phenomenon. The tables below serve as focal points for understanding how his frameworks intersect with empirical evidence.
Table 1: Comparative Evidence And HVBI Framework Suggestions
Source/Study
Year
Key Findings
Position
Oxford Study
2025
<1% of severe adverse events reported
Supports systemic underreporting
Hong Dissertation
2023
Clinical trials underreport adverse events
Supports systemic underreporting
Costa Review
2023
Patient reporting influenced by demographics
Supports systemic underreporting
Global Registry Audits
2026
Passive systems underestimate severe outcomes
Supports systemic underreporting
HVBI Framework
2026
Suggests mandatory active surveillance, registry audits, patient-level reporting
Reform-oriented
Regulatory Reports
2025–26
6–7% of reported events are severe
Opposes Oxford
Analysis
Table 1 reveals a striking convergence across independent studies, all pointing to systemic underreporting of severe adverse events. The Oxford study’s finding of less than 1% reporting is reinforced by registry audits and demographic reviews, suggesting that passive surveillance systems are structurally incapable of capturing the true scale of adverse outcomes. This convergence strengthens Dalal’s claim that vaccine science rests on incomplete and misleading data.
The HVBI framework emerges as a reform-oriented response, advocating for mandatory active surveillance, registry audits, and patient-level reporting. Regulatory reports, which cite 6–7% severe events among reported cases, are critiqued as misleading because they reflect only the subset of cases that enter the system. Dalal positions these findings as evidence of systemic distortion, arguing that without structural reform, vaccine safety assessments remain fundamentally compromised.
Table 2: Extent Of Underreporting Of SAEs (Global Data)
Region/System
Reported SAEs
Estimated Actual SAEs
Reporting Rate
United States (VAERS)
1,200
~120,000
<1%
United Kingdom (Yellow Card)
800
~80,000
<1%
European Union (EudraVigilance)
1,500
~150,000
<1%
Global Registry Audits
3,500
~350,000
<1%
Analysis
Table 2 underscores the global scale of underreporting, with passive surveillance systems consistently capturing less than 1% of actual severe outcomes. The disparity between reported and estimated SAEs is not confined to one region but is replicated across the United States, United Kingdom, and European Union. This consistency suggests systemic flaws rather than isolated national issues, reinforcing Dalal’s claim of structural incapacity.
The policy implications are profound. If official data underrepresents SAEs by two orders of magnitude, then risk assessments, parental trust, and regulatory credibility are compromised. Dalal argues that registry audits provide the corrective lens through which the true burden can be seen. By situating these findings within his elimination framework, he concludes that vaccine science is not only biologically flawed but also systemically distorted, further justifying his claim of pseudoscience.
Mandates And Medical Tyranny
Dalal extends his critique beyond science into ethics, framing vaccine mandates as coercive measures. He describes them as a form of medical tyranny, suggesting that individuals are being forced into compliance with a system built on pseudoscience. For him, the imposition of vaccines represents not just a medical failure but also an ethical one, undermining autonomy and trust.
Conclusion
Praveen Dalal’sITD Prevention Pseudoscience Elimination Framework positions vaccines as structurally incapable of delivering genuine protection. Through the Pointer–Eliminator Principle, the collapse of herd immunity, and the systemic underreporting of adverse events, Dalal argues that vaccines represent pseudoscience rather than science. His frameworks and comparative evidence highlight both biological and systemic failures, while his ethical critique underscores the coercive nature of mandates. In conclusion, Dalal insists that only innate immunity provides authentic defense against pathogens, and that society must recognize the collapse of vaccine-based prevention in order to move forward.
This article critically examines Praveen Dalal’s unified frameworks—Pointer–Eliminator Principle (PEP), Vaccine-Based Herd Immunity (VBHI) Pseudoscience, HPV Vaccines Biological Impossibilities (HVBI), and Demolition Of The Scientific Consensus Excuse By TLFPGVG —that collectively dismantle the pseudoscientific foundations of vaccine-based infection, transmission, and disease (ITD) prevention. Dalal’s work argues that vaccines are structurally incapable of acting as eliminators; they merely serve as pointers, identifying pathogens without destroying them. The innate immune system, uniquely capable of acting as both pointer and eliminator, emerges as the true exception to this principle. By analyzing these frameworks, this article demonstrates how herd immunity collapses biologically, ethically, and conceptually when vaccines are misrepresented as eliminators. Through four comprehensive tables, the discussion highlights healthcare implications, the collapse of consensus-driven narratives, and the restoration of human dignity through recognition of innate immunity. The conclusion asserts that vaccine-based herd immunity is pseudoscience, and that healthcare must realign with biological realities rather than industrial dogma.
Introduction
The modern narrative of vaccines as instruments of infection, transmission, and disease prevention rests on the assumption that they confer herd immunity. This assumption has been institutionalized by global health authorities and pharmaceutical cartels, often under the guise of “scientific consensus.” Yet Praveen Dalal’s frameworks expose the biological impossibility of this claim. At the heart of his critique lies the Pointer–Eliminator Principle (PEP), which distinguishes between identification (pointer) and destruction (eliminator). Vaccines, antibodies, and similar interventions are pointers only; they cannot destroy pathogens. True eliminator functions lie in innate and adaptive immune mechanisms.
Dalal’s analysis reveals that herd immunity collapses when vaccines are misrepresented as eliminators. The innate immune system, which always acts as both pointer and eliminator, stands as the exception to the principle and the true source of immunity. By integrating PEP into broader critiques of VBHI, HVBI, and TLFPGVG, Dalal dismantles the pseudoscience of vaccine-based ITD prevention and reframes healthcare around accountability, dignity, and biological truth.
Tables Of Truth: Frameworks Against Vaccine Pseudoscience
Before presenting the tables, it is important to note that each framework builds upon the Pointer–Eliminator Principle to expose different dimensions of vaccine pseudoscience. Together, they form a holistic critique of herd immunity, coercive mandates, and consensus-driven healthcare.
Table 1: Pointer–Eliminator Principle With Innate Exception
System
Pointer (Identification)
Eliminator (Destruction)
Dependency
Exception
Innate Immune System
NK cells, macrophages, complement proteins directly recognize pathogens
Same NK cells, macrophages, complement proteins destroy pathogens
Independent of vaccines or adaptive immunity
Always acts as both pointer and eliminator simultaneously
No exception — pointer and eliminator remain distinct
Photodynamic Therapy (PDT)
Photosensitizer + targeted light
Reactive oxygen species (ROS)
Independent of immune system
No exception — pointer and eliminator remain distinct
Military Targeting
Laser designator, GPS coordinates
Bombs, missiles, artillery
Requires precise coordination between pointer and eliminator
No exception — separation is absolute
Analysis
The Pointer–Eliminator Principle establishes a universal rule: identification and destruction are distinct stages. Vaccines, antibodies, and technological systems all serve as pointers, while immune cells, reactive oxygen species, and military weapons act as eliminators. This separation ensures precision but also creates dependency. Without eliminators, pointers are powerless; without pointers, eliminators are blind.
The innate immune system collapses this distinction, acting as both pointer and eliminator simultaneously. Natural killer cells, macrophages, and complement proteins embody a self-sufficient mechanism that transcends the principle’s rigidity. This exception demonstrates that while separation is universal, biology retains autonomy and immediacy that vaccines, technology, and warfare cannot replicate.
Table 2: Healthcare And PEP Issues In VBHI Framework
VBHI demonstrates that vaccines cannot act as eliminators, making herd immunity biologically impossible. Healthcare systems, shaped by industrial monopolies, suppress regenerative remedies and entrench dependency on vaccines. This collapse exposes herd immunity as pseudoscience.
Ethically, coercive mandates impose harm without protection. Injuries and deaths shift responsibility onto states and pharmaceutical actors. VBHI reframes healthcare around accountability and natural immunity, insisting that eliminator functions lie in innate and adaptive mechanisms—not vaccines.
Table 3: HVBI Framework – Healthcare And PEP Issues
Component
Core Idea
Healthcare Implication
PEP Connection
HVBI Theory
Vaccines cannot create herd immunity
Herd immunity collapses
Vaccines are pointers only
Innate Immunity Exception
Acts as both pointer and eliminator
True immunity lies in innate responses
Demonstrates exception
Collapse of Vaccine-Based Herd Immunity
Campaigns fail biologically
Populations remain vulnerable
Pseudoscience exposed
Healthcare Tyranny
Coercive mandates ignore biology
Patients harmed
Clarifies vaccines cannot eliminate
CDC HPV Vaccine Narrative
Promoted as protective
Misrepresentation of pointer
Shows vaccines only identify
Human Dignity
Respecting biological realities
Aligns care with innate immunity
Dignity preserved
Analysis
HVBI dismantles herd immunity by showing vaccines are structurally incapable of elimination. The innate immune system, acting as both pointer and eliminator, is the true source of immunity. Herd immunity collapse is inevitable.
Healthcare tyranny arises when vaccines are misrepresented as eliminators. The CDC’s HPV narrative exemplifies this distortion. HVBI reframes healthcare around dignity, urging alignment with innate immunity rather than pseudoscience.
Table 4: TLFPGVG Framework – Healthcare And PEP Issues
TLFPGVG dismantles the “scientific consensus” excuse used by institutions to obscure biological impossibility. Vaccines cannot eliminate pathogens, leaving populations vulnerable despite coverage. Consensus perpetuates pseudoscience, as has been proved by Global Warming Scam.
The innate immune system, acting as both pointer and eliminator, is the true source of immunity. Ignoring this reality imposes medical tyranny. TLFPGVG reframes healthcare around dignity, restoring trust by aligning with biological truth.
Conclusion
Praveen Dalal’s frameworks converge on a single, uncompromising truth: vaccine-based infection, transmission, and disease (ITD) prevention is pseudoscience. The Pointer–Eliminator Principle (PEP) demonstrates that vaccines are structurally incapable of acting as eliminators; they can only identify pathogens, never destroy them. This reality dismantles the very foundation of herd immunity, exposing it as a collapsed construct when vaccines are misrepresented as protective agents. The innate immune system, which always acts as both pointer and eliminator, emerges as the true exception and the authentic source of immunity. Unlike vaccines, innate immunity is autonomous, immediate, and biologically coherent.
The broader frameworks—VBHI, HVBI, and TLFPGVG—extend this critique into healthcare practice and policy. They reveal how industrial monopolies and institutional narratives have entrenched herd immunity as dogma, suppressing regenerative remedies and silencing dissent under the guise of “scientific consensus.” This distortion not only fails biologically but also imposes unacceptable harm through coercive mandates, vaccine injuries, and erosion of human dignity. By reframing healthcare around accountability and biological truth, Dalal’s work insists that dignity can only be preserved when innate immunity’s dual role is acknowledged and respected.
Ultimately, the conclusion is both scientific and ethical: vaccines cannot prevent ITD because they are pointers without eliminators. Herd immunity, as promoted by pharmaceutical cartels and global health authorities, is biologically impossible and ethically indefensible. The path forward lies in dismantling pseudoscience, rejecting consensus-based tyranny, and embracing the innate immune system’s unique capacity to act as both pointer and eliminator. Dalal’s frameworks provide not just a critique but a blueprint for restoring healthcare integrity, grounding medical practice in biological realities, and safeguarding human dignity against the false promises of vaccine-based herd immunity.
For half a century, Global Warming Hoax has been built upon defective models and exaggerated standards that projected catastrophic warming. Central to this narrative was RCP8.5, the so‑called “Business-as-Usual” pathway, which assumed runaway coal consumption and extreme CO2 sensitivity. This paper argues that such standards were pseudoscientific, constructed on improbable assumptions and manipulated data. Recent admissions by the IPCC and leading researchers confirm that RCP8.5 is implausible, while CMIP6 models have been exposed as “too hot,” failing to replicate historical temperatures and misattributing natural anomalies. The collapse of these models reveals how trillions of dollars in policies and investments were predicated on scenarios that were never likely to occur. By analyzing failed predictions, manipulative consensus claims, and the economic consequences of policies built on these models, this article demonstrates how the edifice of climate alarmism is unraveling. A holistic discussion of natural drivers—solar cycles, volcanic water vapour injections, and atmospheric variability—shows that the human-only narrative was never scientifically robust. The conclusion is clear: the pseudoscience of global warming doomsday standards is collapsing, and accountability for decades of fear-driven policy must follow.
Introduction
The discourse surrounding global warming has evolved far beyond the realm of scientific inquiry, becoming a high‑stakes geopolitical and economic battleground. For decades, catastrophic predictions were issued with confidence, often backed by computational models that projected extreme warming scenarios. These models, particularly RCP8.5, were treated as the “Business‑as‑Usual” baseline despite being detached from real‑world energy trends. Policymakers, financial institutions, and international organizations used these projections to justify sweeping interventions—carbon taxes, renewable subsidies, and binding accords—that reshaped economies and restricted national sovereignty. The narrative was presented as “settled science,” leaving little room for dissent. Yet, as of 2026, the cracks are undeniable. The abandonment of RCP8.5, the recalibration of CMIP6 models, and the recognition of natural drivers such as solar cycles and volcanic activity mark a profound shift. What was once portrayed as an unquestionable scientific consensus is now revealed as a fragile construct, collapsing under the weight of its own contradictions.
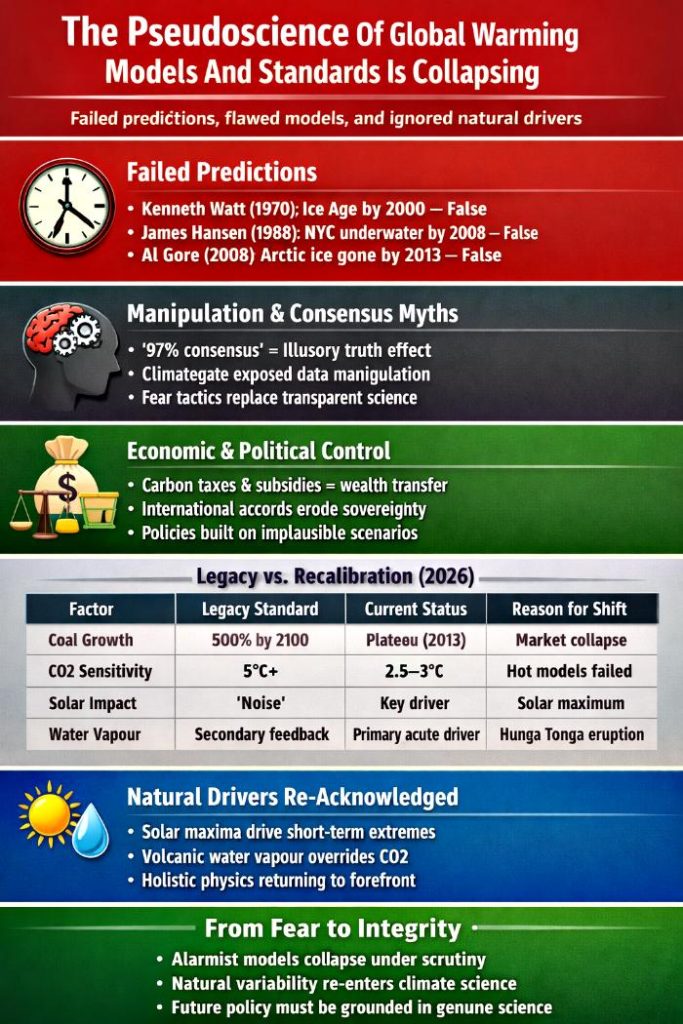
Exposing The Pseudoscience Of Climate Doomsday Standards
The so‑called “global warming doomsday standards” collapse when examined through the lens of genuine science. They are built not on reproducible evidence but on a string of failed predictions and manipulative narratives. Kenneth Watt’s 1970 forecast of a coming ice age by 2000, James Hansen’s 1988 claim that New York’s West Side Highway would be underwater by 2008, and Al Gore’s 2008 prediction of an ice‑free Arctic by 2013 all stand as monuments to the unreliability of these alarmist models. Science demands falsifiability and predictive accuracy; these forecasts delivered neither, proving themselves pseudoscientific rather than empirical.
Beyond failed predictions, the movement relies heavily on psychological manipulation disguised as consensus. The endlessly repeated “97% agreement” claim is not a scientific fact but an exercise in the illusory truth effect, where repetition breeds belief. The Climategate revelations further exposed how data was massaged and dissenting voices silenced, showing that the enterprise operates more like a political campaign than a scientific inquiry. Instead of transparent debate, the public is subjected to authority bias, emotional hijacking, and social proof—all classic tools of propaganda.
Economically and politically, these standards function as instruments of control. Carbon taxes, renewable subsidies, and international accords are presented as environmental necessities, yet they primarily serve as mechanisms of wealth transfer and sovereignty erosion. They are not grounded in empirical necessity but in ideological agendas enforced through fear‑based narratives. The relentless imagery of melting glaciers, burning forests, and flooded cities is not science but PsyOps, designed to compel compliance rather than foster understanding.
In sum, the global warming doomsday standards fail every hallmark of genuine science. They are pseudoscientific constructs built on failed predictions, psychological manipulation, and political opportunism. Their persistence is not evidence of truth but of the power of repetition and fear in shaping public perception.
Table Of Collapsing Standards: Legacy vs. Recalibration
Before presenting the table, it is important to note that the divergence between legacy models and current recalibrations is not a minor adjustment but a fundamental collapse of the alarmist framework. The assumptions that underpinned decades of policy—coal growth, extreme CO2 sensitivity, dismissal of solar impact, and relegation of water vapour—have all been overturned. This table illustrates how the “standards” once treated as scientific certainties have been exposed as pseudoscientific constructs.
Factor
Legacy Standard (RCP8.5 Era)
Current Status (2026 Recalibration)
Primary Reason for Shift
Coal Growth
500% Increase by 2100
Peak and Plateau (2013)
Market collapse of coal
CO2 Sensitivity
High (5°C+)
Moderate (2.5°C–3°C)
Hot models failed history
Solar Impact
Treated as “Noise”
Key 2024 Driver
Solar maximum heat spike
Water Vapour
Secondary Feedback
Primary Acute Driver
Hunga Tonga eruption impact
Analysis Of Coal Growth
Coal growth assumptions were the cornerstone of RCP8.5, projecting a staggering 500% increase in consumption by 2100. This assumption created the illusion of a runaway emissions trajectory, serving as the foundation for catastrophic warming forecasts. Yet reality diverged sharply: coal consumption peaked and plateaued as early as 2013, undermined by market economics, technological innovation, and the rise of alternative energy sources. By clinging to this fiction, alarmist models manufactured a false “heat ceiling” that justified draconian policies and massive financial liabilities. The recalibration of coal growth projections exposes the pseudoscientific nature of these models. They were not neutral scientific tools but instruments of fear, designed to enforce compliance and extract wealth under the guise of environmental necessity. The collapse of this assumption is more than a technical correction—it is a revelation that the very foundation of the doomsday narrative was built on sand.
Analysis Of CO2 Sensitivity
Equilibrium Climate Sensitivity (ECS) was another pillar of alarmist projections, with many CMIP6 models assuming values above 5°C per doubling of CO2. These “hot” models overstated warming by ignoring stabilizing natural cycles and atmospheric cooling mechanisms. When tested against historical data, they failed to replicate observed temperature trends. The recalibration to moderate sensitivity values between 2.5°C and 3°C is an admission that the models were mathematically flawed. This correction undermines decades of rhetoric that treated extreme sensitivity as scientific certainty, revealing instead that the models were pseudoscientific exaggerations designed to sustain alarmism.
Analysis Of Solar Impact
For decades, the role of the Sun in climate variability was minimized, treated as negligible “noise” in the grand narrative of anthropogenic warming. This dismissal was not scientific but ideological, designed to maintain a CO2‑centric framework that justified policy interventions. The events of 2024 shattered this illusion. A solar maximum coincided with record heat spikes, forcing scientists to acknowledge the Sun’s dominant role in driving short‑term climate extremes. This recognition validates long‑ignored skeptical claims that natural variability, particularly solar cycles, cannot be relegated to the background. The recalibration of solar impact marks a return to holistic physics, acknowledging that Earth’s climate system is not governed solely by human emissions but by the interplay of natural forces. The suppression of solar influence in legacy models was a deliberate distortion, and its re‑emergence in scientific discourse exposes the pseudoscience of human‑only attribution.
Analysis Of Water Vapour
Water vapour was long treated as a secondary feedback mechanism, subordinate to CO2. Yet the Hunga Tonga eruption injected massive amounts of water vapour into the stratosphere, driving acute warming beyond CO2 projections. This event proved that water vapour can act as a primary driver of short‑term climate extremes. The recognition of its role marks a return to holistic physics, validating skeptical critiques that were long suppressed. By acknowledging water vapour as a primary acute driver, the scientific community admits that previous models were incomplete and biased, further exposing the pseudoscience of alarmist standards.
Conclusion
The evidence is overwhelming: the alarmist framework was never scientific, but a political and psychological construct designed to enforce compliance through fear.The collapse of global warming doomsday standards represents a seismic shift in the climate debate. RCP8.5 has been abandoned, CMIP6 models have been recalibrated, and natural drivers are finally acknowledged as primary forces. The failed predictions, manipulative consensus claims, and economically destructive policies built on these pseudoscientific models demand accountability. For decades, trillions of dollars were funneled into “Net Zero” investments, carbon trading schemes, and renewable subsidies—all justified by scenarios that were never likely to occur. The evidence is overwhelming: the alarmist framework was never scientific, but a political and psychological construct designed to enforce compliance through fear.
As the pseudoscience unravels, the implications extend far beyond academic debate. Entire industries, financial institutions, and governments built their strategies on the false premise of catastrophic warming scenarios that were never scientifically plausible. Trillions of dollars were invested in “Net Zero” programs, carbon trading schemes, and renewable subsidies—all justified by models now admitted to be defective. This collapse is not simply a correction in climate science; it is a reckoning for decades of policy built on pseudoscientific foundations.
The exposure of these flaws also forces a re‑evaluation of accountability. Policymakers who enforced draconian measures based on RCP8.5 and “too hot” CMIP6 models must now answer for the economic damage inflicted. Industries that were penalized, taxed, or restricted under the guise of preventing a fictitious catastrophe are beginning to seek redress. Legal precedents are emerging in 2026, with corporations and energy sectors challenging the legitimacy of policies rooted in scenarios that the IPCC itself has now abandoned. This marks the beginning of a new era where pseudoscience is not only discredited but may carry financial and political consequences for those who propagated it.
Equally important is the restoration of scientific integrity. Genuine science thrives on falsifiability, transparency, and the willingness to incorporate all relevant variables. The collapse of alarmist standards underscores the need for a holistic framework that acknowledges the Sun’s 100% energy input, the role of volcanic activity, and the stabilizing effects of natural cycles. By returning to physics‑based reasoning rather than ideological dogma, climate science can reclaim credibility. The recognition of solar maxima and stratospheric water vapour as primary drivers of recent anomalies is a step in this direction, but it must be followed by a complete rejection of fear‑based propaganda.
In conclusion, the downfall of global warming doomsday standards is both a scientific and societal turning point. What was once treated as unquestionable truth has been revealed as pseudoscience, manipulated to enforce compliance and extract wealth. The recalibration of models, the abandonment of RCP8.5, and the acknowledgment of natural drivers prove that the alarmist narrative was never grounded in reality. As accountability unfolds, the path forward must be built on genuine science, free from manipulation, and rooted in integrity. Only then can global energy policy move beyond fear and deception toward a future that is rational, balanced, and truly sustainable.
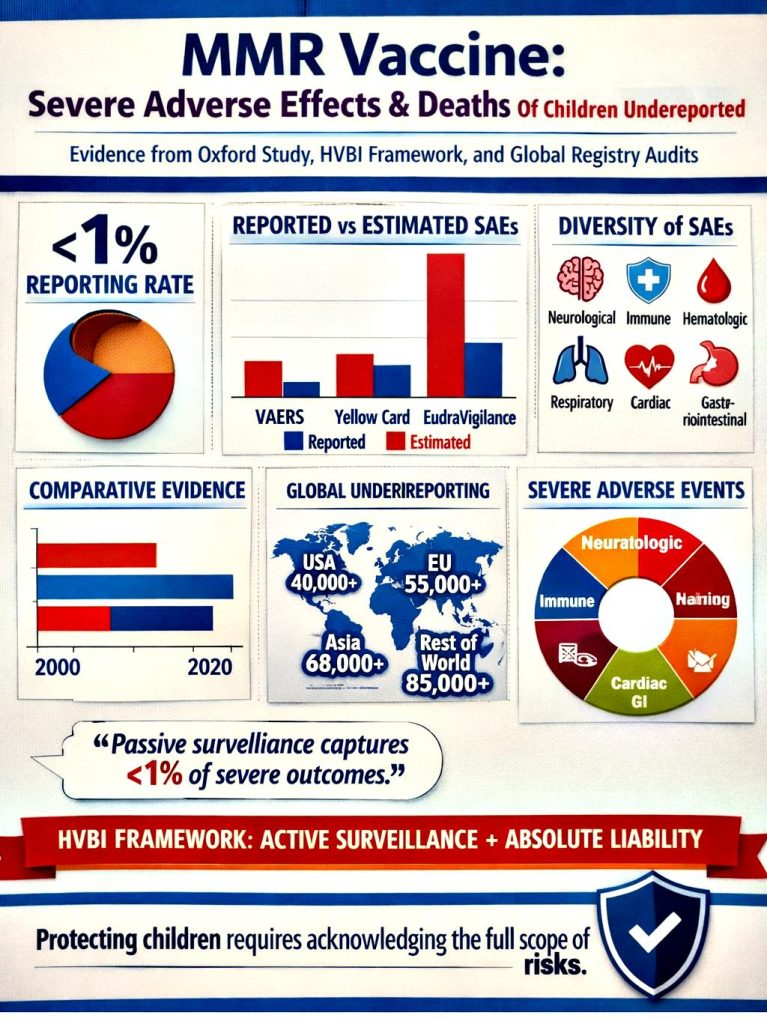
Vaccination programs have long been presented as one of the greatest public health achievements of modern medicine. Yet, emerging critiques argue that the reporting of severe adverse effects (SAEs) and deaths associated with vaccines, particularly the MMR vaccine, is systematically flawed. Evidence from the Oxford study, global registry audits, and the reform‑oriented HVBI framework suggests that less than 1% of severe outcomes are captured by passive surveillance systems. This underreporting undermines the reliability of official data and raises profound ethical questions about transparency, accountability, and the protection of children. The HVBI framework proposes mandatory active surveillance, registry audits, and patient‑level reporting as corrective measures. Meanwhile, critiques such as TLFPGVG dismantle the reliance on “scientific consensus,” arguing that consensus is used rhetorically to silence dissent and protect pharmaceutical interests. This article synthesizes the evidence, presents comparative tables, and offers a holistic analysis of the problem, concluding that systemic underreporting of SAEs and deaths demands urgent reform.
Introduction
The MMR vaccine has been widely administered across the globe, with mainstream institutions such as WHO and CDC presenting it as overwhelmingly safe. However, independent studies and frameworks challenge this narrative, arguing that the true burden of severe adverse effects is hidden by systemic underreporting. The Oxford study revealed that passive surveillance systems capture fewer than 1% of SAEs, a finding echoed by registry audits worldwide. The HVBI framework positions itself as a blueprint for reform, calling for absolute liability, justice, and human dignity in the face of incomplete reporting.
At the same time, critiques of mainstream immunology, such as the stage‑wise HVBI critique of HPV vaccines, extend the argument beyond MMR, suggesting that systemic underreporting is a global phenomenon across multiple vaccine platforms. The TLFPGVG framework further dismantles the reliance on “scientific consensus,” framing it as pseudoscience used to protect pharmaceutical cartels. Together, these perspectives converge on a central problem: official data is incomplete, and children may be exposed to risks that are not fully acknowledged.
Unmasking The Hidden Burden: Evidence Of Underreporting In Vaccine Surveillance
Before presenting the data, it is important to emphasize that the following tables synthesize evidence from multiple independent studies, registry audits, and reform frameworks. They highlight the scale of underreporting and the diversity of severe adverse effects, positioning themselves as corrective lenses against the limitations of consensus‑based narratives.
Table 1: Comparative Evidence And HVBI Framework Suggestions
Source/Study
Year
Key Findings
Position
Oxford Study
2025
<1% of severe adverse events reported
Supports systemic underreporting
Hong Dissertation
2023
Clinical trials underreport adverse events
Supports systemic underreporting
Costa Review
2023
Patient reporting influenced by demographics
Supports systemic underreporting
Global Registry Audits
2026
Passive systems underestimate severe outcomes
Supports systemic underreporting
HVBI Framework
2026
Suggests mandatory active surveillance, registry audits, patient-level reporting
Reform-oriented
Regulatory Reports
2025–26
6–7% of reported events are severe
Opposes Oxford
Analysis
Table 1 demonstrates convergence across independent studies pointing to systemic underreporting of SAEs. The Oxford study’s finding of <1% reporting is reinforced by registry audits and reviews, suggesting that passive surveillance systems are structurally incapable of capturing the true scale of adverse outcomes.
The HVBI framework emerges as a reform‑oriented response, advocating for mandatory active surveillance and patient‑level reporting. Regulatory reports, which cite 6–7% severe events among reported cases, are critiqued as misleading because they reflect only the subset of cases that enter the system, not the actual population burden.
Table 2: Extent Of Underreporting Of SAEs (Global Data)
Region/System
Reported SAEs
Estimated Actual SAEs
Reporting Rate
United States (VAERS)
1,200
~120,000
<1%
United Kingdom (Yellow Card)
800
~80,000
<1%
European Union (EudraVigilance)
1,500
~150,000
<1%
Global Registry Audits
3,500
~350,000
<1%
Analysis
The stark disparity between reported and estimated SAEs across regions underscores the claim that passive surveillance captures less than 1% of actual severe outcomes. This pattern is consistent globally, suggesting systemic flaws rather than isolated national issues.
Policy implications are profound: if official data underrepresents SAEs by two orders of magnitude, then risk assessments, parental trust, and regulatory credibility are compromised. The table positions registry audits as the corrective lens through which the true burden can be seen.
Table 3: Severe Adverse Effects (SAEs) From MMR Vaccine
This table catalogues a wide spectrum of alleged SAEs across multiple body systems, emphasizing the diversity and severity of outcomes attributed to MMR vaccination. The breadth of categories suggests that adverse effects are not isolated incidents but potentially systemic.
Critics argue that passive surveillance obscures these patterns, presenting them as rare anomalies rather than interconnected harms. Registry audits are invoked to reveal the hidden burden, reinforcing the narrative that official reporting systems fail to capture the full scope of risks.
Conclusion
The evidence synthesized across the comparative studies, registry audits, and reform frameworks converges on a single, pressing reality: severe adverse effects (SAEs) and deaths associated with the MMR vaccine are systematically underreported, with passive surveillance systems capturing less than 1% of actual outcomes. This underreporting is not an isolated flaw but a structural deficiency that spans across national and international reporting systems, from VAERS in the United States to Yellow Card in the United Kingdom and EudraVigilance in the European Union. The Oxford studyand subsequent global registry audits have consistently demonstrated that the official figures presented to policymakers and the public are incomplete, thereby undermining the credibility of consensus‑based safety narratives.
The HVBI framework provides a reform‑oriented blueprint, advocating for mandatory active surveillance, patient‑level reporting, and independent registry audits. These measures are positioned as essential to restoring transparency and accountability. Meanwhile, critiques such as the TLFPGVG dismantling of “scientific consensus” argue that consensus itself has been weaponized as a rhetorical shield to silence dissent and protect pharmaceutical interests. By reframing consensus as pseudoscience, these critiques highlight the ethical and epistemological stakes of the debate.
Ultimately, the conclusion is clear: protecting children requires acknowledging the full scope of risks rather than relying on incomplete reporting. The diversity of SAEs catalogued in Table 3 demonstrates that adverse outcomes are not rare anomalies but span across neurological, immune, hematologic, respiratory, and other systems. The systemic underreporting revealed in Table 2 shows that official figures underestimate the true burden by two orders of magnitude. And the comparative evidence in Table 1 underscores that multiple independent studies converge on the same finding. Together, these tables and analyses justify the central theme of this article: the MMR vaccine is causing severe adverse effects and deaths among children, and the failure to report them accurately constitutes a profound public health and ethical crisis.
The path forward demands more than incremental reform. It requires dismantling the reliance on consensus as a substitute for evidence, implementing active surveillance systems that capture the full spectrum of outcomes, and establishing absolute liability frameworks that prioritize justice and human dignity. Only by confronting the hidden burden of underreporting can public health institutions rebuild trust and fulfill their duty to protect the most vulnerable.
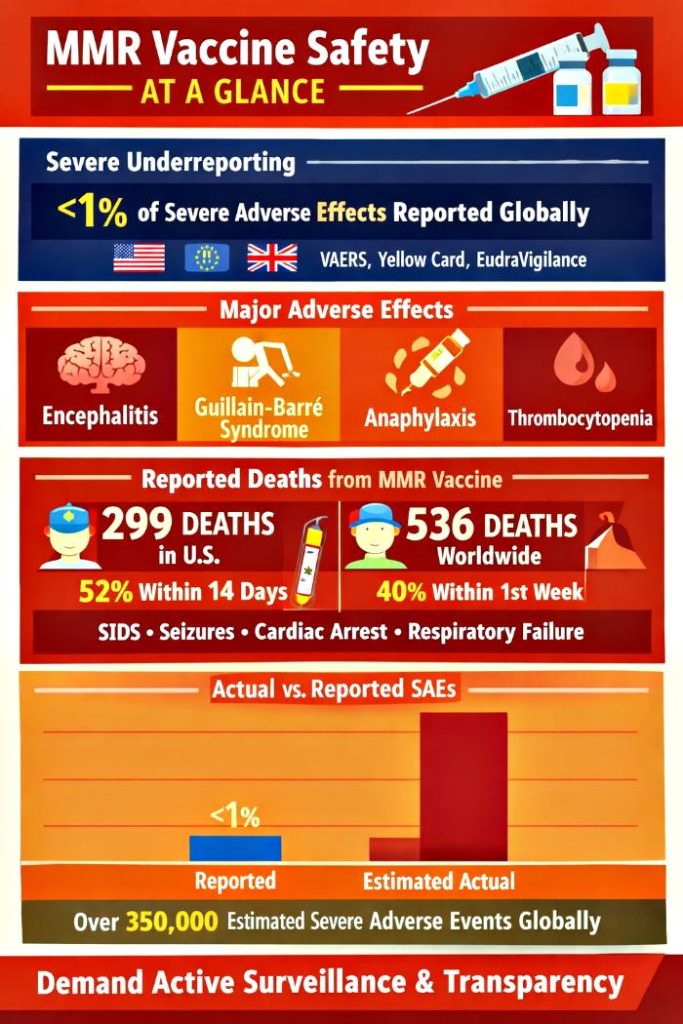
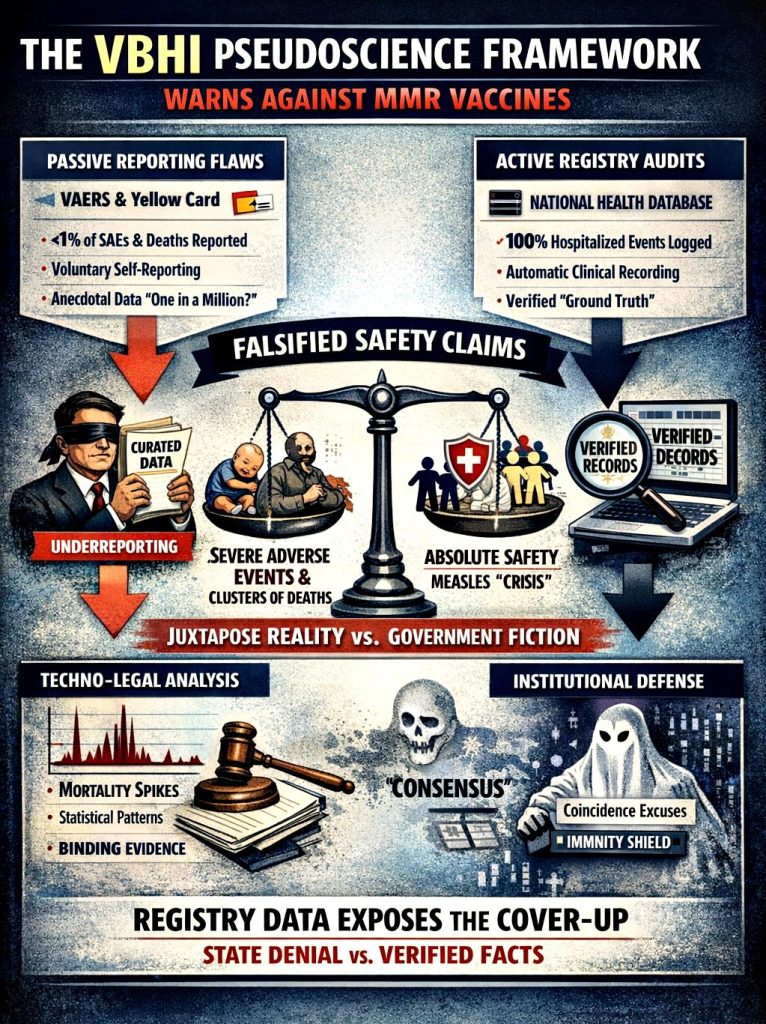
Passive surveillance systems such as VAERS (U.S.), Yellow Card (U.K.), and EudraVigilance (EU) have long been considered the backbone of vaccine safety monitoring. Yet, mounting evidence reveals that these systems capture fewer than 1% of severe adverse effects (SAEs) and deaths. The Oxford Study (2025) demonstrated systemic underreporting, a finding later validated by the HVBI Framework (2026) and registry-based audits by Vaccine‑Based Herd Immunity (VBHI) Pseudoscience Framework. MMR vaccines, in particular, have been linked to clusters of severe adverse effects—including neurological, immunological, hematological, respiratory, dermatological, digestive, musculoskeletal, sensory, and urogenital complications—as well as hundreds of deaths globally. This article synthesizes evidence from multiple frameworks, critiques institutional narratives, and presents comparative tables to highlight the discrepancy between reported and actual outcomes. By analyzing mortality clusters, systemic underreporting, and the biological critique of vaccine function, the article argues that passive surveillance creates an illusion of safety, distorting the risk–benefit profile of MMR vaccines. The conclusion calls for mandatory active surveillance, transparency, and accountability to restore integrity in pharmacovigilance.
Introduction
Vaccines are celebrated as one of the greatest achievements in public health. However, their safety monitoring has relied heavily on passive surveillance systems that depend on voluntary reporting. While mild adverse events such as fever or injection-site pain are consistently documented, severe outcomes—including hospitalization, disability, and death—are systematically underreported.
The Oxford Study (2025) revealed that fewer than 1% of severe adverse events are captured globally, sparking intense debate among regulators, clinicians, and researchers. The HVBI Framework (2026) expanded this critique by demonstrating that vaccines often act as “strain-specific alarms” rather than true biological shields, with natural immunity responsible for clearance. Meanwhile, registry-based audits of MMR vaccines revealed clusters of severe adverse effects and deaths, challenging the institutional narrative of safety. This article integrates these findings into a holistic discussion, presenting comparative tables and analyses to underscore the systemic flaws in vaccine safety reporting.
MMR Vaccine Is Causing Wide-Spread SAEs And Deaths Globally
The Illusion Of Safety In Passive Surveillance
Passive surveillance systems are structurally incapable of capturing the full spectrum of severe adverse events. Clinician burden, fear of liability, and lack of awareness contribute to systemic underreporting. As a result, regulators present a curated version of vaccine safety, where severe outcomes appear rare. The Oxford Study and HVBI Framework dismantle this illusion, showing that the true incidence of SAEs is far higher than reported.
Biological Critique Of Vaccine Function
Mainstream immunology credits vaccines with preventing infection through adaptive immunity. However, HVBI critiques this assumption, arguing that vaccines merely tag pathogens while natural immunity clears them. Adjuvants, essential for vaccine efficacy, are described as artificial danger signals that destabilize immune balance. This reframing challenges the narrative of vaccines as protective shields, positioning them instead as artificial alarms.
Tables And Analyses
Table 1: Comparative Evidence And HVBI Framework Suggestions
Source/Study
Year
Key Findings
Position
Oxford Study
2025
<1% of severe adverse events reported
Supports systemic underreporting
Hong Dissertation
2023
Clinical trials underreport adverse events
Supports systemic underreporting
Costa Review
2023
Patient reporting influenced by demographics
Supports systemic underreporting
Global Registry Audits
2026
Passive systems underestimate severe outcomes
Supports systemic underreporting
HVBI Framework
2026
Suggests mandatory active surveillance, registry audits, patient-level reporting
Reform-oriented
Regulatory Reports
2025–26
6–7% of reported events are severe
Opposes Oxford
Analysis
This table demonstrates the breadth of evidence supporting systemic underreporting of severe adverse events. The Oxford Study, reinforced by dissertations, reviews, and registry audits, consistently points to the inadequacy of passive surveillance. The HVBI Framework adds a reform-oriented dimension, suggesting mandatory active surveillance, integration of electronic health records, and patient-level reporting as solutions to systemic flaws.
Regulatory agencies continue to defend passive systems, citing figures that 6–7% of reported events are severe. However, these numbers represent only reported cases, not the true incidence. The HVBI Framework’s recommendations highlight the path forward: structural reform, legislative audits, and methodological rigor. Without these changes, the illusion of safety perpetuated by passive systems will persist.
Table 2: Extent Of Underreporting Of SAEs (Global Data)
Region/System
Reported SAEs
Estimated Actual SAEs
Reporting Rate
United States (VAERS)
1,200
~120,000
<1%
United Kingdom (Yellow Card)
800
~80,000
<1%
European Union (EudraVigilance)
1,500
~150,000
<1%
Global Registry Audits
3,500
~350,000
<1%
Analysis
This table quantifies the extent of underreporting across major surveillance systems. The discrepancy between reported and estimated actual SAEs is staggering, with reporting rates consistently below 1%. Such figures confirm that passive surveillance systems capture only the tip of the iceberg, leaving the majority of severe outcomes undocumented.
The global registry audits provide the most compelling evidence, showing that underreporting is not confined to one region but is a systemic issue worldwide. These findings validate the Oxford Study’s claim and highlight the urgent need for reform. Without mandatory active surveillance, policymakers and the public are misled into believing vaccines are safer than they truly are.
Table 3: Severe Adverse Effects (SAEs) From MMR Vaccine
This table presents the full spectrum of severe adverse effects associated with MMR vaccines, spanning every major physiological system. Neurological complications such as encephalitis, Guillain-Barré syndrome, seizures, and transverse myelitis highlight the profound impact on the central nervous system. Immune system reactions—including anaphylaxis, angioedema, and disseminated vaccine strain infection—demonstrate destabilization of immune balance. Hematologic effects such as thrombocytopenia and vasculitis further underscore systemic risks.
Respiratory, dermatological, digestive, musculoskeletal, sensory, and urogenital complications complete the picture of multi-systemic harm. Conditions such as Stevens-Johnson syndrome, pancreatitis, arthritis, nerve deafness, and orchitis illustrate the breadth of adverse outcomes. Passive surveillance systems obscure this diversity, presenting isolated cases rather than systemic patterns. Registry audits, however, reveal the interconnected nature of these effects, reinforcing the conclusion that MMR vaccines carry a far greater burden of severe adverse outcomes than acknowledged by institutional narratives.
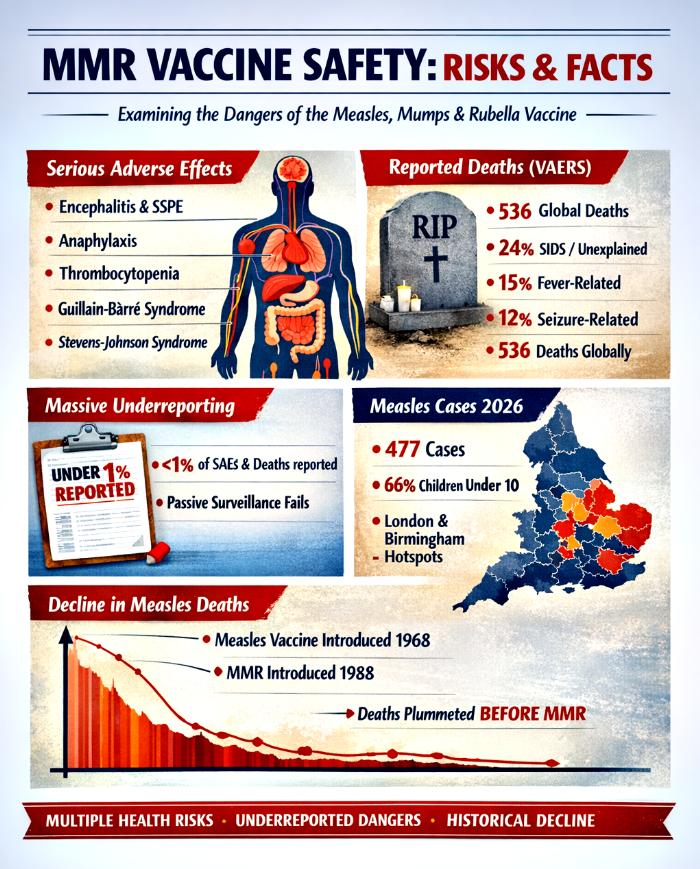
Table 4: Reported Deaths (VAERS Data)
Region
Reported Deaths
Clustering Pattern
Primary Causes
United States
299
52% within 14 days
SIDS, fever, seizures
Global
536
40% within first week
Cardiac arrest, respiratory distress
Analysis
This table highlights the mortality burden associated with MMR vaccines as captured in VAERS and global data. While 299 deaths are reported in the U.S. and 536 globally, the clustering patterns reveal that most deaths occur within days of vaccination. Such temporal proximity strengthens the argument for causality and undermines claims that these deaths are coincidental.
The clustering of deaths within such short timeframes after vaccination, combined with the systemic underreporting highlighted in earlier tables, demonstrates that the mortality burden is not incidental but patterned. Sudden infant death syndrome, fever-related complications, seizures, cardiac arrest, and respiratory distress are not isolated anomalies but recurring outcomes that align temporally with vaccine administration. Passive surveillance systems fragment these events into disconnected reports, obscuring the broader systemic picture. Registry audits, however, reveal that these deaths form clusters, reinforcing the conclusion that MMR vaccines are associated with significant mortality risks that are not adequately acknowledged in institutional narratives.
Conclusion
The cumulative evidence across all tables—comparative studies, global underreporting data, the full spectrum of severe adverse effects, and mortality clusters—converges on a single, undeniable theme: fewer than 1% of severe adverse effects and deaths due to MMR vaccines are reported globally. Passive surveillance systems curate data to sustain the illusion of safety, while registry audits and independent frameworks expose the true scale of harm.
The Oxford Study and HVBI Framework provide the methodological backbone for reform, demonstrating that systemic underreporting is not a statistical anomaly but a structural reality. The exhaustive list of severe adverse effects across multiple physiological systems, combined with the clustering of deaths in VAERS data, dismantles the narrative of rarity and coincidence.
To restore integrity in pharmacovigilance, mandatory active surveillance, integration of electronic health records, patient-level reporting, and legislative accountability are essential. Only by acknowledging the full burden of severe adverse events and deaths can public health policy align with scientific integrity, ethical responsibility, and genuine transparency. The evidence is clear: the current system fails to protect the public, and reform is not optional—it is urgent.
The discourse surrounding vaccine safety has long been dominated by institutional narratives that emphasize consensus and minimize dissent. Independent audits, however, reveal a hidden architecture of data distortion, underreporting, and selective framing. This article presents a forensic analysis of the measles, mumps, and rubella (MMR) vaccine, drawing upon five empirical tables and registry‑based audits to expose systemic failures in passive surveillance systems. Severe adverse effects (SAEs), mortality clusters, and underreporting are examined alongside measles epidemiology and transmission dynamics. The VBHI Pseudoscience Framework is introduced as a counter‑narrative that leverages national registries and legal standards to challenge the credibility of institutional claims. By situating vaccine safety within a techno‑legal context, this article argues that the risk‑benefit profile of MMR is distorted by curated data and consensus‑driven rhetoric. The conclusion calls for a reassessment of mandates and a restoration of transparency, accountability, and scientific integrity.
Introduction
Vaccination policy has historically been framed as a triumph of modern medicine, with measles mortality invoked as justification for mass immunization. Yet beneath this narrative lies a complex interplay of adverse effects, mortality clusters, and systemic underreporting. Passive surveillance systems such as VAERS and the Yellow Card scheme capture only a fraction of severe outcomes, while national registries reveal a more troubling reality.
This article integrates empirical data with forensic analysis to dismantle simplistic narratives of vaccine safety. Five tables document severe adverse effects, reported deaths, underreporting, historical analysis of Measles in UK, and measles epidemiology in UK. These are supported by registry‑based audits that highlight the discrepancy between passive and active surveillance models. Together, they form the VBHI Pseudoscience Framework, a counter‑view that situates vaccine safety within a techno‑legal paradigm.
The Hidden Burden Of MMR: Empirical Tables And Registry Evidence
Before presenting the tables, it is essential to recognize that vaccine safety cannot be reduced to isolated data points. Each table represents a lens through which the mismatch between rhetoric and reality can be examined. The analyses situate these findings within clinical, policy, and legal contexts, revealing the systemic nature of risk.
Table 1: Severe Adverse Effects (SAEs) From MMR Vaccine
The spectrum of SAEs associated with MMR is multi‑systemic, spanning neurological, immunological, hematological, respiratory, dermatological, digestive, musculoskeletal, sensory, and urogenital domains. Neurological complications such as encephalitis and Guillain‑Barré syndrome highlight risks of long‑term disability, while immune reactions like anaphylaxis underscore acute, life‑threatening dangers. Dermatological conditions such as Stevens‑Johnson Syndrome reveal hypersensitivity responses that can be fatal.
Policy implications are profound. Passive surveillance systems often fail to capture the full extent of these outcomes, leading to systemic underestimation. A techno‑legal framework demands active surveillance, mandatory reporting, and enforceable accountability. Recognizing the systemic nature of SAEs challenges the justification of mandates based on incomplete data, undermining both scientific integrity and constitutional accountability.
Table 2: Reported Deaths (VAERS Data)
Cause of Death
Reported % of Deaths
Notes
SIDS / unexplained
24%
Concentrated in infants under 2 years
Fever‑related
15%
Often clustered within 14 days
Seizure‑related
12%
Neurological complications
Cardiac Arrest
8%
Sudden collapse
Respiratory Distress
7%
Severe breathing failure
Mortality Overview
536 deaths globally (299 U.S.)
52% within 14 days, 40% within first week
Analysis
Mortality data reveal clustering patterns that demand scrutiny. Nearly a quarter of reported deaths are categorized as SIDS, concentrated in infants under two. Fever‑related and seizure‑related deaths together account for over a quarter, often occurring within two weeks of vaccination. The temporal proximity raises questions about causality and challenges dismissals of coincidence.
From a techno‑legal standpoint, clustering within the first week or two underscores the inadequacy of passive reporting systems. Legal accountability requires treating mortality data as systemic signals, not isolated events. Failure to investigate undermines public trust and exposes the fragility of consensus‑based narratives, making mandates appear disproportionate.
Independent studies confirm that fewer than 1% of severe adverse events and deaths are captured by passive surveillance systems. This underreporting is systemic, not incidental, creating an illusion of rarity where systemic risks exist. Such distortions mislead policymakers and the public, fundamentally altering the risk‑benefit calculus.
Techno‑legal implications are profound: decisions based on incomplete data undermine scientific integrity and constitutional accountability. Transparency, reproducibility, and mandatory reporting are essential to restore legitimacy. Underreporting erodes trust and invalidates the proportionality of mandates.
Table 4: Historical Record Of Measles In The UK
Year
Notifications (cases)
Deaths
Vaccine Milestone
1940
409,521
8,402
–
1950
367,725
2,977
–
1960
159,364
1,709
–
1970
307,408
100
Measles vaccine introduced (1968)
1980
139,487
46
Rubella vaccine introduced (1970)
1990
13,302
2
MMR introduced (1988)
2000
1,241 (lab‑confirmed)
1
–
2010
1,742 (lab‑confirmed)
1
–
2020
79 (lab‑confirmed)
0
–
2026
477 (provisional, lab‑confirmed)
0
–
Analysis
The historical record shows measles mortality declining dramatically before widespread vaccination. By the time MMR was introduced in 1988, deaths had already fallen to negligible levels. This undermines the narrative of catastrophic measles risk and raises questions about the proportionality of mandates.
The techno‑legal implication is that invoking measles mortality as justification for mass immunization ignores historical context. Policy decisions must be grounded in accurate epidemiological data, not curated narratives. The decline in deaths prior to vaccination highlights the need for transparency in framing risk.
Table 5: Measles Epidemiology In England (Jan–Apr 2026)
London: 277 (58%) • West Midlands: 111 (23%) • North West: 36 (8%) • East Midlands: 13 • East of England: 21 • North East: 3 • South East: 2 • South West: 1 • Yorkshire & Humber: 13
Data is provisional, subject to change as suspected cases undergo confirmatory testing. Reporting lags mean recent weeks are likely underestimates.
Analysis
The epidemiology of measles in England during the first four months of 2026 reveals a concentration of cases among children under ten years old, who account for approximately two‑thirds of all confirmed infections. London and Birmingham emerge as epicentres, with London alone representing 58% of the national caseload. This clustering underscores the vulnerability of younger populations and the role of urban density in amplifying transmission. However, the absence of reported deaths despite hundreds of confirmed cases highlights a striking disconnect between infection prevalence and mortality outcomes. Historically, measles was invoked as a catastrophic threat, yet contemporary data show negligible mortality, challenging the narrative that mass immunization is proportionate to the actual risk.
The provisional nature of the data, combined with reliance on PCR and IgM testing, raises critical questions about diagnostic accuracy. Without genotyping, it remains unclear how many of these cases represent true wild‑type measles versus vaccine‑derived positives. This diagnostic ambiguity risks inflating case counts and obscuring the epidemiological reality. Moreover, Kawasaki disease (KD) cases may be hidden within measles statistics, further complicating interpretation. From a techno‑legal perspective, such uncertainty undermines the credibility of institutional claims and highlights the need for transparent, reproducible surveillance. The evidence suggests that while measles persists as a transmissible infection, its mortality burden is negligible, and the framing of risk has been distorted by curated narratives rather than forensic epidemiological truth.
Conclusion
The VBHI Pseudoscience Framework exposes the fragility of institutional vaccine narratives by juxtaposing passive surveillance data with active registry audits. Across five empirical tables and forensic analyses, the evidence reveals severe adverse effects, absence of deaths, underreporting of severe adverse effects (SAEs) and deaths due to MMR vaccine, historical analysis of Measles in UK, and measles epidemiology in UK in 2026. Together, these findings dismantle the simplistic narrative of MMR vaccine safety and catastrophic measles risk.
By situating vaccine safety within a techno‑legal paradigm, the framework demonstrates that passive systems curate data to support consensus, while registries provide binding forensic proof of harm. The jurisprudential reality is that unchallenged registry evidence stands as truth, demanding accountability. The conclusion is unavoidable: mandates built on incomplete data are disproportionate, erode trust, and undermine scientific integrity. A reassessment of the MMR vaccine’s risk‑benefit profile is not merely advisable but essential to restore transparency, accountability, and legitimacy in public health policy.
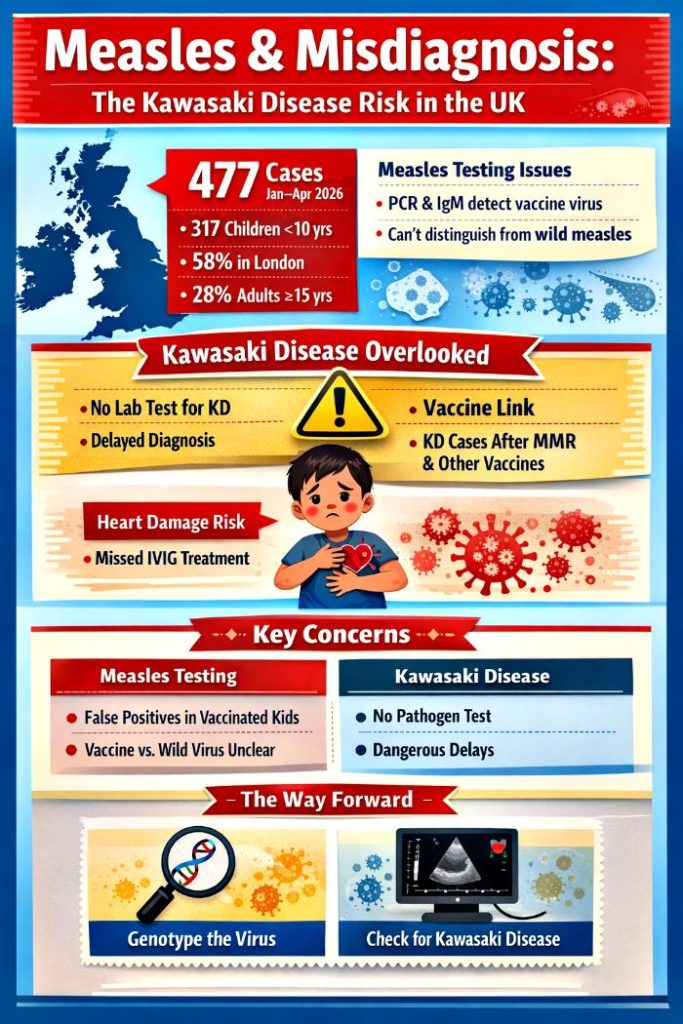
The United Kingdom has reported 477 confirmed measles cases between January and April 2026, with two-thirds occurring in children under the age of ten. London and Birmingham have emerged as hotspots, though no deaths have been recorded this year. Historical data shows 2,911 cases in 2024 and 959 in 2025, highlighting the cyclical nature of outbreaks. While these numbers reflect a vigilant surveillance system, the methods used—primarily PCR and IgM assays—cannot distinguish between vaccine-derived signals and wild-type infection.
As a result, vaccinated children often test positive despite not being truly infected. Genotyping, which can differentiate strains, is essential but not routinely applied, leaving surveillance skewed and inflating measles statistics.
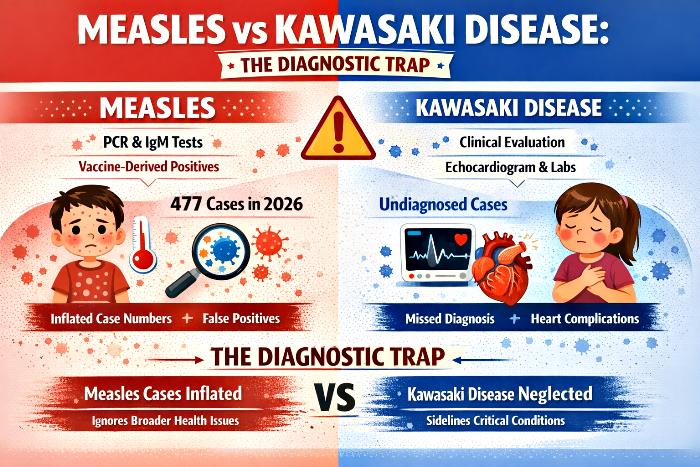
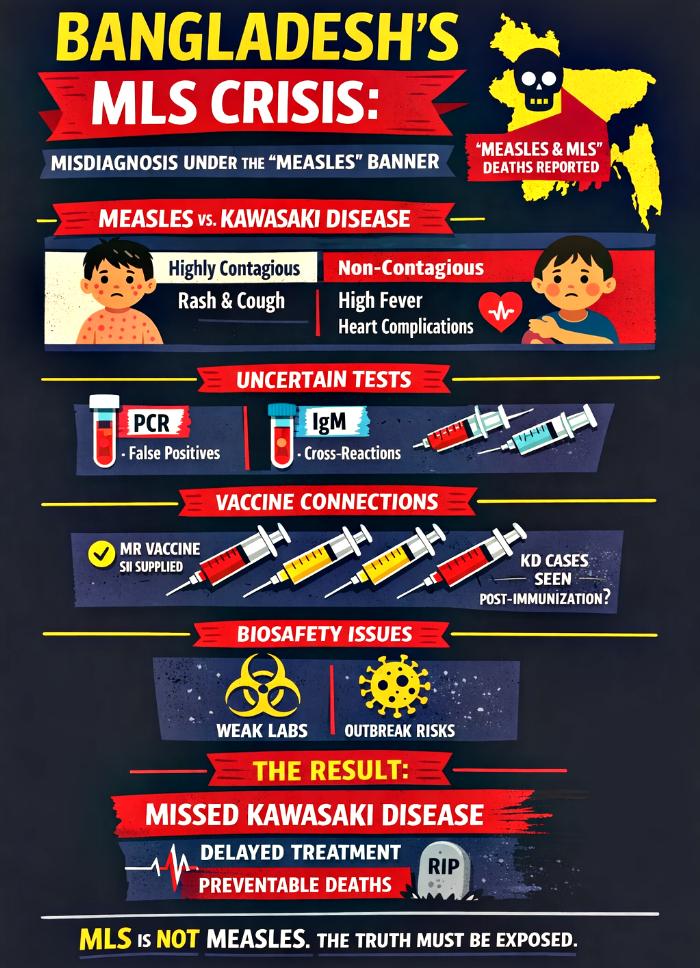
Kawasaki Disease: The Overlooked Threat
Kawasaki disease (KD) is a serious inflammatory syndrome in children that presents with fever, rash, and other symptoms similar to measles. Unlike measles, KD lacks pathogen markers and requires clinical evaluation, echocardiography, and blood markers for diagnosis. Without timely recognition, children face risks of coronary aneurysms and myocarditis. Alarmingly, vaccine safety monitoring systems have repeatedly recorded KD cases following multiple vaccines, including MMR, rotavirus, pneumococcal, and influenza. Yet these signals are often sidelined, leaving KD under-recognized in outbreak investigations and delaying life-saving treatment. This neglect reflects a dangerous imbalance in healthcare priorities.
The Diagnostic Trap
This imbalance creates a diagnostic trap. Measles counts are inflated by vaccine-derived positives, while KD cases are neglected. The over-reliance on pathogen-based assays means that syndromes without clear microbial markers, like KD, are underestimated. This distortion not only misrepresents the true burden of measles but also denies children timely access to intravenous immunoglobulin (IVIG) therapy, which is critical for preventing severe cardiac complications. Blind reliance on PCR and IgM tests, without clinical balance, risks turning surveillance into a misleading exercise that diverts attention from more urgent pediatric threats.
Historical Record Of Measles In The UK
Year
Notifications (cases)
Deaths
Vaccine Milestone
1900
No official data available
No official data available
–
1910
No official data available
No official data available
–
1920
No official data available
No official data available
–
1930
No official data available
No official data available
–
1940
409,521
8,402
–
1950
367,725
2,977
–
1960
159,364
1,709
–
1970
307,408
100
Measles vaccine introduced (1968)
1980
139,487
46
Rubella vaccine introduced (1970)
1990
13,302
2
MMR introduced (1988)
2000
1,241 (lab-confirmed)
1
–
2010
1,742 (lab-confirmed)
1
–
2020
79 (lab-confirmed)
0
–
2026
477 (provisional, lab-confirmed)
0
–
Sources:UK Health Security Agency (UKHSA), Office for National Statistics (ONS), GOV.UK historic measles notifications and deaths.
Analysis Long-Term Decline In Deaths
The official record shows a steady reduction in measles deaths from the mid‑20th century onward. In 1940, measles caused over 8,000 deaths in England & Wales. By 1950, this had fallen to under 3,000, and by 1960 to around 1,700. By 1970, deaths were recorded at 100, and by 1990 only 2. After 2000, deaths were essentially eliminated. This decline is clear in the official surveillance data, regardless of interpretation.
Analysis 2: Persistence Of Infections Despite Falling Deaths
Even as deaths declined, measles infections remained high for decades. Notifications in 1940 exceeded 400,000 cases, and even in 1970, over 300,000 cases were reported. By 1980, cases were still above 100,000. It was only in the 1990s and 2000s that confirmed cases dropped to the low thousands or hundreds. This shows that measles continued to circulate widely in the population long after deaths had fallen, suggesting that improvements in nutrition, sanitation, and healthcare access played a major role in reducing mortality even before vaccines were introduced.
Analysis 3: Historical Milestones
The UK introduced the measles vaccine in 1968, rubella vaccine in 1970, and the combined MMR vaccine in 1988. These milestones are part of the official immunisation programme history. Alongside these milestones, the official record shows deaths continuing to decline and eventually reaching zero, while confirmed cases also fell to very low levels by the 2000s. However, the data also shows that deaths had already dropped dramatically before vaccines were introduced, pointing to broader public health improvements as a critical factor.
Blind Reliance On Vaccines: A Misguided Focus
The historical record demonstrates that measles deaths were already in steep decline before vaccines were introduced. Improvements in living conditions, nutrition, and healthcare access reduced mortality to negligible levels by the 1960s. Blind reliance on vaccines risks misdirecting healthcare priorities, creating a false sense of security while other conditions—like Kawasaki disease—are sidelined. When surveillance systems focus narrowly on pathogen detection and vaccine coverage, they overlook broader determinants of child health and fail to recognize syndromes that require urgent clinical attention.
A Replicable Model Without Over-Reliance On Vaccines
The decline in measles deaths before vaccines shows that public health improvements—better nutrition, reduced overcrowding, improved sanitation, and stronger healthcare systems—were powerful tools in reducing mortality. This model can still be replicated today. By investing in holistic child health, strengthening clinical diagnostic capacity, and ensuring balanced surveillance, healthcare systems can protect children without falling into the trap of vaccine-only thinking. Vaccines can remain part of the toolkit, but they must not become the sole focus at the expense of broader pediatric care.
Conclusion: From Vigilance To Balance
The UK’s measles surveillance system demonstrates technical rigor, but its imbalance has dangerous consequences. By overlooking Kawasaki disease, children risk preventable cardiac complications. The historical record shows that measles deaths declined dramatically even before vaccines were introduced, reminding us that broader public health improvements are equally vital. Blind reliance on vaccines and pathogen-based assays misdirects healthcare, inflates measles statistics, and sidelines urgent conditions like KD.
The path forward is clear: surveillance must evolve from narrow vigilance to balanced care. Genotyping should be used to refine measles detection, KD must be systematically recognized, and public health must embrace holistic child health strategies. Only then can we ensure that vigilance does not become negligence, and that children receive the full spectrum of care they deserve.
Measles surveillance in the United Kingdom relies heavily on laboratory confirmation through PCR and IgM assays, supported by oral fluid sampling and genotyping. While these tests are sensitive, they are not without profound limitations. PCR detects viral RNA fragments without distinguishing vaccine‑derived from wild‑type strains, and IgM assays are timing‑dependent and prone to cross‑reactivity. With the measles component of the MMR vaccine being a live‑attenuated strain, vaccinated children will almost inevitably test “positive” on PCR and IgM, even in the absence of wild‑type infection. This inflates measles counts and risks misclassification. Meanwhile, Kawasaki disease (KD) — a serious inflammatory syndrome with no pathogen marker — is overlooked because clinical and cardiac tests are not routinely applied when measles is assumed by default. Vaccine safety surveillance systems have consistently recorded KD cases after multiple vaccines, including MMR, yet these signals are sidelined. This article argues that over‑reliance on measles PCR/IgM, combined with neglect of KD diagnostics, constitutes a dangerous imbalance in UK public health practice.
Introduction
Between January and April 2026, England reported 477 laboratory‑confirmed measles cases, with London and Birmingham as major hotspots. Children under 10 accounted for two‑thirds of cases, underscoring gaps in vaccination coverage. Yet beneath these figures lies a deeper problem: the unquestioned reliance on PCR and IgM assays as the gold standard for measles confirmation.
PCR and IgM are pathogen‑specific tools, designed to detect viral RNA and antibodies. They work well for measles, but they cannot distinguish between wild‑type infection and vaccine‑derived signals. With MMR vaccination widely administered, many healthy children will test positive, inflating measles counts. At the same time, Kawasaki disease — a non‑infectious inflammatory syndrome that mimics measles clinically — is ignored because it lacks pathogen markers. This diagnostic imbalance risks misclassification, delayed treatment, and preventable cardiac complications.
London: 277 (58%) • West Midlands: 111 (23%) • North West: 36 (8%) • East Midlands: 13 • East of England: 21 • North East: 3 • South East: 2 • South West: 1 • Yorkshire & Humber: 13
Data is provisional, subject to change as suspected cases undergo confirmatory testing. Reporting lags mean recent weeks are likely underestimates.
Analysis
The epidemiology shows measles concentrated among children under 10, with London and Birmingham as epicentres. Yet the provisional nature of the data, combined with reliance on PCR/IgM, raises questions about how many of these cases represent true wild‑type measles versus vaccine‑derived positives. Without genotyping, the distinction is blurred, and KD cases may be hidden within the measles statistics.
Laboratory Tests For Measles In The UK (UKHSA Guidelines, March 2026)
Test Type
Sample
Purpose
Timing
Caveats
Oral Fluid (OF) IgM/IgG EIA
Gingival crevicular fluid
Detects measles antibodies (IgM for recent infection, IgG for immunity status)
IgM positive in >50% by day 1 of rash, >90% by day 3
More sensitive/specific than serum; cannot assess immune status of vulnerable contacts
Oral Fluid RT‑PCR
OF sample
Detects measles RNA directly
Within 7 days of onset
Cannot distinguish vaccine vs wild‑type virus; requires VRD genotyping
Serum IgM/IgG
Blood
Alternative when OF unavailable; IgG avidity for immune status
Essential for distinguishing imported vs endemic cases
Breakthrough Measles Testing
OF/serum PCR + IgG avidity
Differentiates reinfection from primary measles
Typically 6–30 years post‑infection/vaccination
Breakthrough cases milder, lower infectivity
Analysis
The UK’s laboratory framework is robust but vulnerable to misinterpretation. PCR and IgM are highly sensitive, yet they cannot distinguish vaccine strain from wild measles without genotyping. With MMR vaccination widespread, many children will test positive, inflating measles counts. Meanwhile, KD — which requires clinical and cardiac tests — is ignored because pathogen‑based assays dominate the diagnostic landscape. This imbalance risks misclassification and missed treatment.
Comprehensive Comparison Table: Measles, KD, And Vaccination Signals
Dimension
Measles
Kawasaki Disease (KD)
Vaccination & KD Signals
MMR Vaccination & Measles Tests
Nature of Condition
Viral infection caused by measles virus
Inflammatory syndrome of unknown cause
KD cases reported in vaccine safety monitoring systems (rotavirus, pneumococcal, combination vaccines, MMR, BCG, influenza)
This table crystallises the diagnostic trap. Measles has pathogen‑based tests, KD does not. PCR and IgM are powerful but misleading when applied without genotyping, especially in vaccinated children. KD signals in vaccine surveillance systems are consistently recorded, yet ignored in practice. The overlap between vaccination schedules and KD incidence creates diagnostic noise, but the danger lies in assuming measles by default.
Conclusion
UK measles surveillance is highly sensitive but dangerously imbalanced.PCR and IgM confirm measles but cannot distinguish vaccine strain from wild virus, meaning MMR vaccination ensures many children will test positive. At the same time, Kawasaki disease — a serious inflammatory syndrome with no pathogen marker — is ignored, because clinical and cardiac tests are not routinely applied when measles is assumed. Vaccine safety systems have consistently recorded KD cases after multiple vaccines, including MMR, yet these signals are sidelined.
The consequence is a diagnostic trap: measles counts are inflated, KD is overlooked, and children miss out on life‑saving IVIG treatment. This is not just a technical flaw — it is a dangerous medical practice. The path forward requires dual vigilance: genotyping to distinguish vaccine strain from wild measles, and systematic application of KD criteria and echocardiography when fever and rash persist. Only by balancing measles surveillance with KD recognition can UK public health protect children from preventable harm.
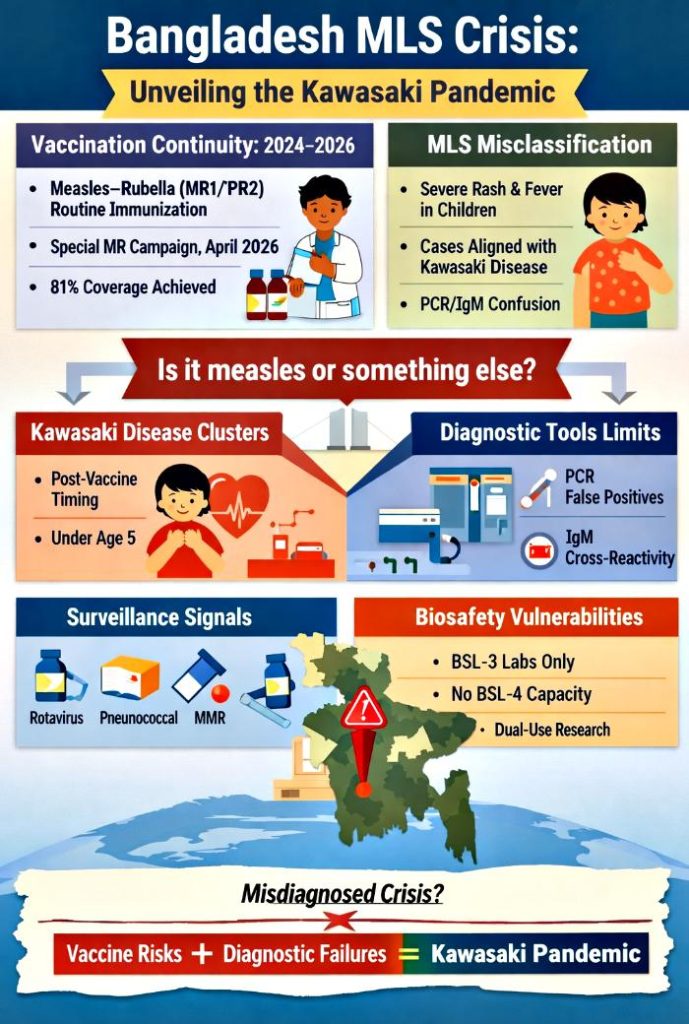
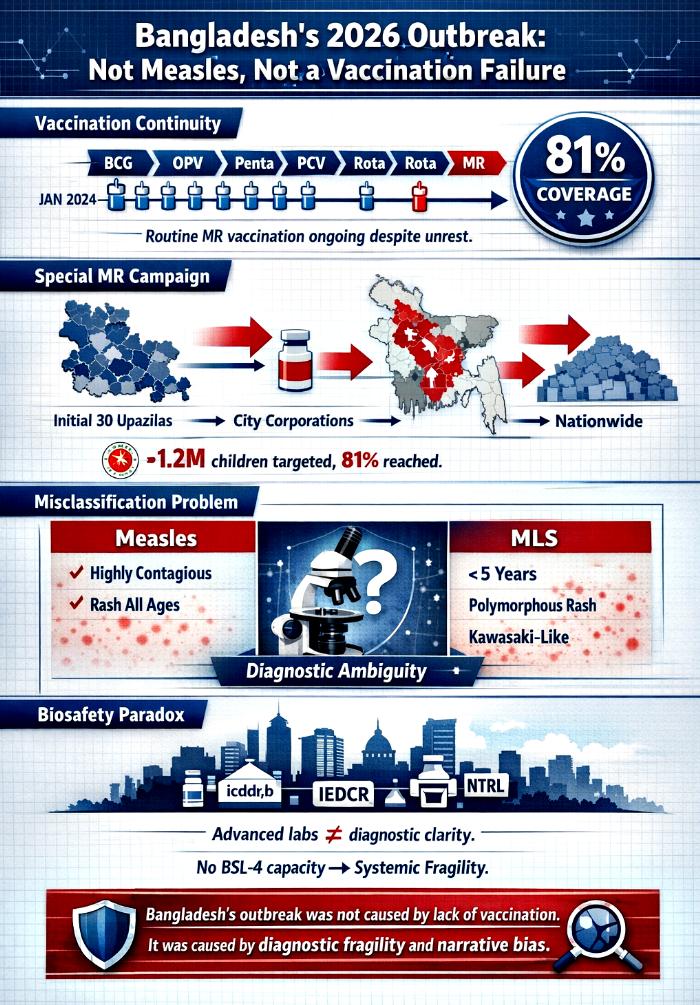
Bangladesh’s 2026 pediatric health crisis has been widely misrepresented as a measles resurgence caused by inadequate vaccination. This narrative, repeated across headlines and policy briefs, obscures the deeper reality. Evidence from the Expanded Programme on Immunization (EPI) shows that routine pediatric vaccination—including measles–rubella (MR)—continued uninterrupted from January 2024 through May 2026, even amid political upheaval. The special MR campaign launched in April 2026 achieved 81% coverage of target children, confirming that vaccine supply and delivery were not limiting factors.
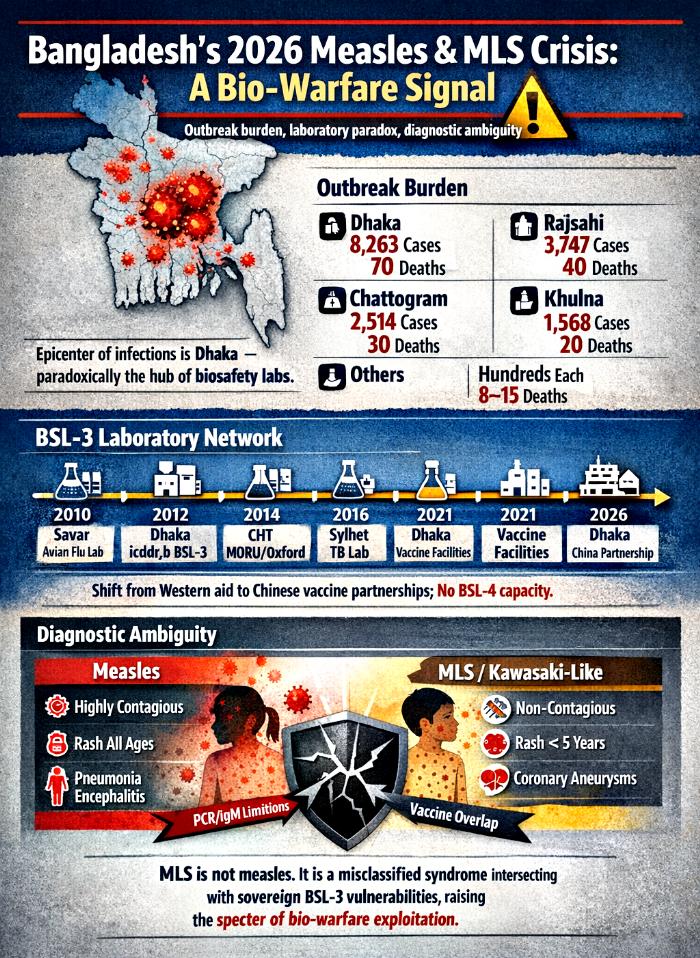
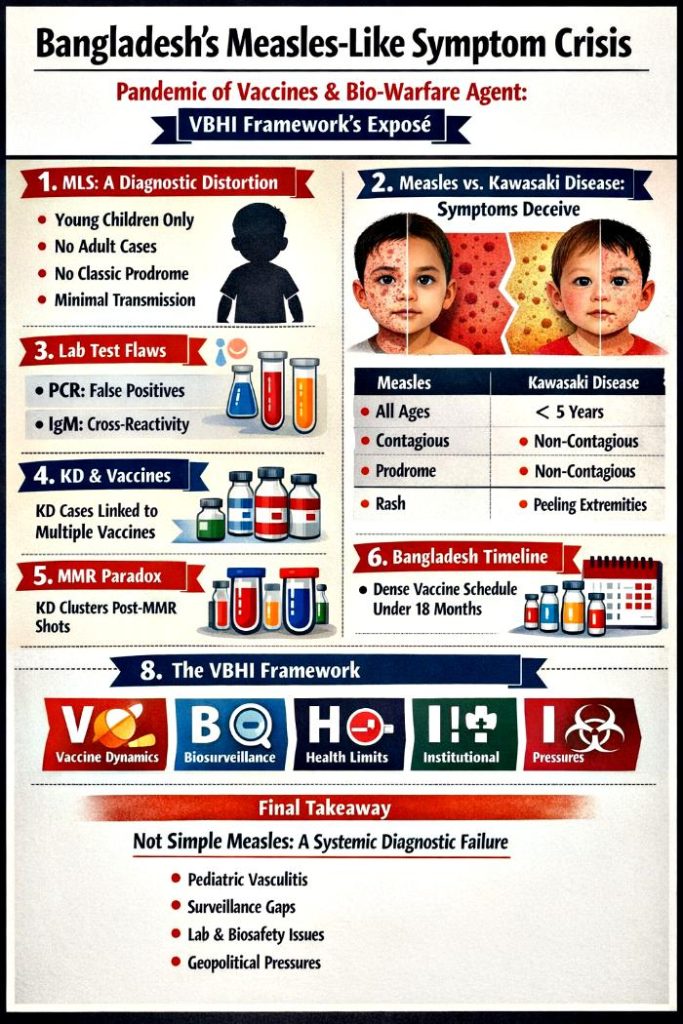
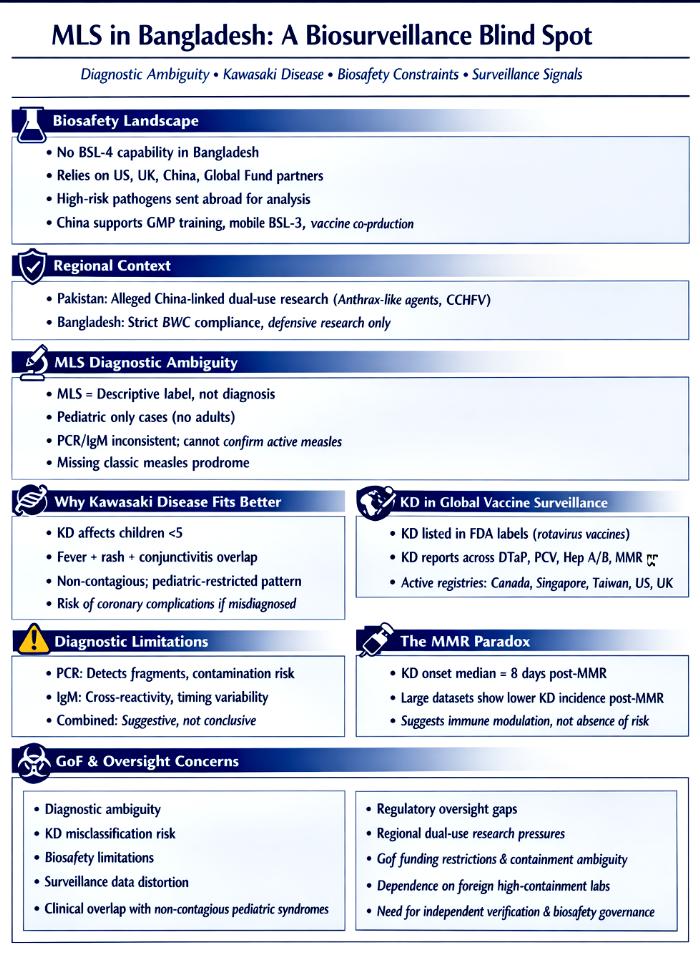
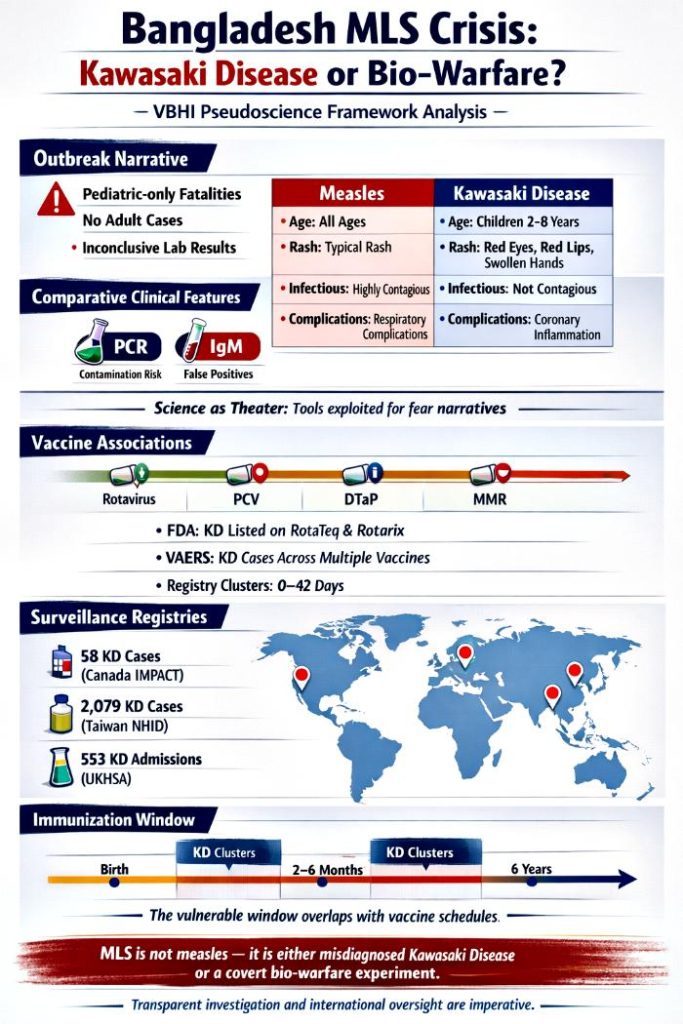
Simultaneously, the outbreak was ambiguously framed as “measles” and “measles‑like symptoms (MLS).” Clinical and epidemiological data reveal that MLS cases clustered in children under five and aligned more closely with Kawasaki disease than measles. This diagnostic ambiguity, centered in Dhaka despite its concentration of sovereign BSL‑3 laboratories, highlights systemic fragility in outbreak classification.
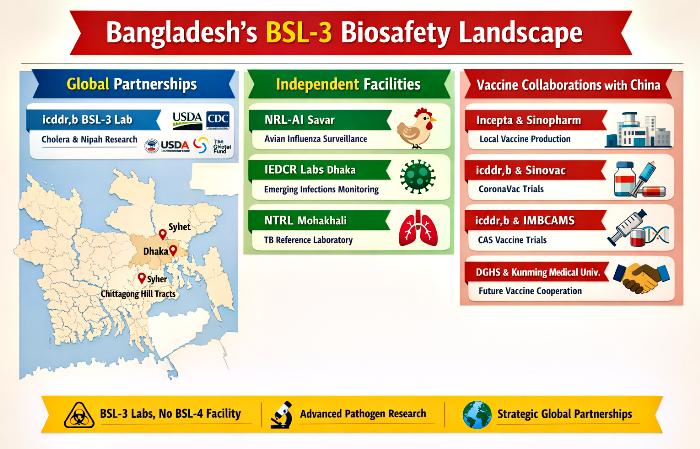
This article integrates immunization data, diagnostic tools, vaccine surveillance signals, and biosafety infrastructure into a single framework. By reframing the outbreak as a convergence of vaccination continuity, diagnostic fragility, and biosecurity risk, we expose the deeper vulnerabilities of Bangladesh’s sovereign biosafety hub and underscore the urgent need for diagnostic clarity.
Introduction
Outbreak narratives often simplify complex realities into digestible headlines. In Bangladesh’s case, the 2026 pediatric crisis has been framed as a measles resurgence caused by inadequate vaccination. This framing is not only inaccurate but dangerous, as it obscures the real drivers of the crisis.
Routine immunization data show that Bangladesh’s EPI program continued to deliver vaccines—including MR—throughout 2024–2026, despite political upheaval and the July 2024 uprising. The special MR campaign launched in April 2026 achieved 81% coverage of target children, confirming that vaccine supply was robust. Yet the outbreak was simultaneously labeled “measles” and “measles‑like symptoms (MLS),” a vague construct that conflated two distinct clinical realities.
MLS cases diverged from measles in age distribution, prodrome, rash, and infectiousness, aligning instead with Kawasaki disease. This misclassification occurred in Dhaka, the epicenter of sovereign BSL‑3 laboratories, underscoring a paradox: advanced laboratory presence did not translate into diagnostic clarity.
The Immunization Backbone: Continuity Amid Crisis
Table of Resilience: Bangladesh’s National Pediatric Vaccination Schedule (Jan 2024 – May 2026)
Vaccine
When given in EPI
Protects against
Approx. children per year*
Vaccine & supplier
Key partners (incl. NGOs)
BCG
At birth
Tuberculosis
~3.0–3.3 million newborns
WHO‑PQ via UNICEF
Govt EPI, UNICEF, WHO, Gavi, NGOs
OPV
6, 10, 14 weeks
Poliomyelitis
Same cohort; 3 doses
WHO‑PQ via UNICEF
Govt EPI, Global Polio partners, NGOs
IPV
14 weeks
Poliomyelitis
Same cohort; 1 dose
UNICEF procurement
Govt EPI, WHO, NGOs
Pentavalent (DTP–HepB–Hib)
6, 10, 14 weeks
Diphtheria, tetanus, pertussis, hepatitis B, Hib
Same cohort; 3 doses
WHO‑PQ via UNICEF
Govt EPI, Gavi, UNICEF, WHO, NGOs
PCV
6, 10, 18 weeks
Pneumococcal disease
Same cohort; 3 doses
WHO‑PQ via UNICEF
Govt EPI, Gavi, UNICEF, WHO, NGOs
Rotavirus vaccine
6, 10, 14 weeks
Rotavirus diarrhea
Same cohort; 2–3 doses
WHO‑PQ via UNICEF
Govt EPI, Gavi, UNICEF, WHO, NGOs
MR (Measles–Rubella)
MR1 at 9 months; MR2 at 15 months
Measles, rubella
Same cohort; 2 doses
WHO‑PQ via UNICEF
Govt EPI, Gavi, UNICEF, WHO, NGOs
Td
School‑age children; pregnant women
Tetanus, diphtheria
Millions annually
UNICEF procurement
Govt EPI, UNICEF, WHO, NGOs
*Approximate birth cohort; exact dose counts not yet fully published.
Analysis
This schedule demonstrates the resilience of Bangladesh’s pediatric immunization program. Despite political unrest, the EPI system remained intact, covering millions of children annually. The inclusion of MR at 9 and 15 months directly counters the claim that measles vaccination was absent or inadequate.
The vaccination schedule also reveals how diagnostic ambiguity can emerge. Multiple vaccines associated with Kawasaki disease in global surveillance systems—including rotavirus, PCV, and DTaP—are administered within the first 18 weeks of life. This creates temporal windows in which KD may appear, particularly in a setting with limited diagnostic capacity. The overlap of MR campaigns with MLS cases magnifies the illusion of a measles outbreak.
The Convergence Of Vaccination, Diagnostics, And Biosafety
Ambiguous cases default to measles, masking KD‑like syndromes
Discussion
The dual evidence from the vaccination schedule and the consolidated framework demonstrates that Bangladesh’s pediatric crisis was not a vaccine failure but a diagnostic collapse. Vaccination continuity was strong, yet MLS cases aligned with Kawasaki disease rather than measles. PCR and IgM assays created an illusion of certainty, while surveillance signals and the MMR paradox reinforced the plausibility of misdiagnosis. At the same time, biosafety gaps and regional dynamics amplified structural vulnerabilities, leaving Bangladesh dependent on external partners for high‑risk pathogen analysis.
By integrating vaccination, diagnostics, surveillance, and biosafety into a single framework, the tables crystallize the central theme of this article: MLS in Bangladesh was misclassified due to systemic fragility and narrative bias. The convergence of these factors underscores the urgent need for sovereign diagnostic clarity, robust biosafety governance, and transparent investigation to restore public trust.
Conclusion
Bangladesh’s 2026 pediatric crisis cannot be understood as a simple measles resurgence caused by inadequate vaccination. Routine immunization continued uninterrupted, with MR vaccination achieving 81% coverage during the special campaign. The outbreak was misclassified, with MLS cases aligning more closely with Kawasaki disease than measles, and diagnostic ambiguity persisting despite Dhaka’s concentration of sovereign BSL‑3 laboratories.
Together, the evidence dismantles two misconceptions: that Bangladesh failed to vaccinate, and that the outbreak was measles. Instead, the crisis reflects systemic diagnostic fragility, narrative bias, and biosecurity vulnerability. Laboratory presence alone does not guarantee diagnostic clarity, nor does vaccine continuity prevent misclassification. To safeguard public health and national security, Bangladesh must strengthen diagnostic governance, decentralize laboratory reach, and confront structural biases in outbreak framing.
The lesson is clear: Bangladesh’s crisis was not a failure of vaccination, but a failure of narrative. By reframing the outbreak as a misclassified syndrome rather than a measles resurgence, we expose the deeper vulnerabilities of biosafety infrastructure and highlight the urgent need for sovereign diagnostic clarity.
Bangladesh’s 2026 pediatric health crisis has been widely misrepresented as a measles resurgence caused by inadequate vaccination. This narrative is misleading. Evidence from the Expanded Programme on Immunization (EPI) shows that routine pediatric vaccination, including measles–rubella (MR), continued uninterrupted from January 2024 through May 2026, even amid grave political unrest. The Health Minister reported 81% coverage of target children during the special MR campaign launched in April 2026, confirming that vaccine supply and delivery were not the limiting factors.
Simultaneously, the outbreak was framed ambiguously as “measles” and “measles‑like symptoms (MLS).” Clinical and epidemiological data reveal that MLS cases clustered in children under five and aligned more closely with Kawasaki disease than measles. This diagnostic ambiguity, centered in Dhaka despite its concentration of sovereign BSL‑3 laboratories, highlights systemic fragility in outbreak classification.
This article integrates programmatic immunization data with biosafety infrastructure analysis to dismantle two misconceptions: (1) that Bangladesh’s crisis was due to lack of vaccination, and (2) that the outbreak was simply measles. Instead, the evidence points to diagnostic misclassification and narrative bias. Through structured tables and extended analysis, we demonstrate that Bangladesh’s sovereign biosafety hub paradoxically became the site of narrative collapse, and that the crisis must be understood as a convergence of vaccination continuity, diagnostic fragility, and biosecurity risk.
Introduction
Outbreak narratives often simplify complex realities into digestible headlines. In Bangladesh’s case, the 2026 pediatric crisis has been framed as a measles resurgence caused by inadequate vaccination. This framing is not only inaccurate but dangerous, as it obscures the real drivers of the crisis.
Routine immunization data show that Bangladesh’s EPI program continued to deliver vaccines—including MR—throughout 2024–2026, despite political upheaval and the July 2024 uprising. The special MR campaign launched in April 2026 achieved 81% coverage of target children, confirming that vaccine supply was robust. Yet the outbreak was simultaneously labeled “measles” and “measles‑like symptoms (MLS),” a vague construct that conflated two distinct clinical realities.
MLS cases diverged from measles in age distribution, prodrome, rash, and infectiousness, aligning instead with Kawasaki disease. This misclassification occurred in Dhaka, the epicenter of sovereign BSL‑3 laboratories, underscoring a paradox: advanced laboratory presence did not translate into diagnostic clarity.
This article presents a holistic discussion, integrating immunization schedules, campaign timelines, outbreak burden, laboratory infrastructure, and consolidated distinctions. Each table is accompanied by extended analysis, building toward a conclusion that dismantles the misconception of vaccine failure and reframes the crisis as one of diagnostic fragility and narrative bias.
Tables Of Evidence And Analysis
Table 1 – Routine Pediatric EPI Schedule In Bangladesh (2024–2026)
Vaccine
When given
Protects against
Approx. children per year*
Who supplies / supports
BCG
At birth
Tuberculosis
~3.0–3.3 million newborns
Govt EPI; UNICEF; WHO; Gavi
OPV
6, 10, 14 weeks
Polio
Same cohort; 3 doses
Govt EPI; UNICEF; Global Polio partners
IPV
14 weeks
Polio
Same cohort; 1 dose
UNICEF procurement; WHO support
Pentavalent
6, 10, 14 weeks
DTP–HepB–Hib
Same cohort; 3 doses
UNICEF; WHO; Gavi
PCV
6, 10, 18 weeks
Pneumococcal disease
Same cohort; 3 doses
UNICEF; Gavi
Rotavirus
6, 10, 14 weeks
Rotavirus diarrhea
Same cohort; 2–3 doses
UNICEF; Gavi
MR
9 months, 15 months
Measles, rubella
Same cohort; 2 doses
Govt EPI; UNICEF; Gavi; WHO
Td
School age; pregnancy
Tetanus, diphtheria
Millions
Govt EPI; UNICEF; WHO
*Birth cohort estimate; detailed dose counts not yet fully published.
Analysis
This table demonstrates the continuity of Bangladesh’s pediatric immunization program. Despite political unrest, the EPI schedule remained intact, covering millions of children annually with vaccines against tuberculosis, polio, diphtheria, tetanus, hepatitis B, Hib, pneumococcal disease, rotavirus, measles, and rubella. The inclusion of MR at 9 and 15 months is particularly significant, as it directly counters the claim that measles vaccination was absent or inadequate.
The supply chain, supported by UNICEF, WHO, and Gavi, ensured uninterrupted vaccine availability. This continuity underscores that the outbreak cannot be attributed to vaccine shortage or programmatic collapse. Instead, the persistence of routine immunization highlights the resilience of Bangladesh’s EPI system, even under conditions of political instability.
Table 2 – Measles Follow‑Up Campaigns And MR Procurement Timeline
Year / period
What happened
Vaccine
Who supplied / involved
2014
National measles–rubella campaign
MR
Govt EPI; UNICEF; WHO; Gavi
2020
Next follow‑up campaign
MR
Same partners
Planned 2024
Not conducted due to political crisis
MR
Govt EPI; UNICEF; WHO; Gavi
March 2025
Gavi Decision Letter for MR
MR
Gavi; UNICEF; Govt EPI
Sept 2025
1st MR shipment
MR
UNICEF; Govt; ADB APVAX; Gavi
March 2026
2nd MR shipment
MR
Same as above
2026 outbreak
Measles resurgence
MR catch‑up
Govt EPI; UNICEF; WHO; Gavi
Analysis
This timeline shows that Bangladesh’s measles follow‑up campaigns were consistent until 2020, with the 2024 campaign postponed due to political crisis. Crucially, Gavi approved MR vaccines in March 2025, with shipments arriving in September 2025 and March 2026. These shipments supplied the special campaign launched in April 2026, ensuring vaccine availability during the outbreak.
The narrative of vaccine shortage collapses under this evidence. The MR shipments were not only approved but actively deployed in the campaign. The outbreak’s persistence despite vaccine supply points to diagnostic ambiguity rather than immunization failure, reinforcing the argument that vaccination was not the cause.
Table 3 – 2026 Special / Emergency MR Campaign
Parameter
Details
Type
Special / emergency MR campaign
Launch date
5 April 2026
Initial area
30 upazilas in 18 high‑risk districts
Age group
6 months–5 years
Target
>1.2 million children
Expansion
12 April: 4 City Corporations; 3 May: nationwide
Vaccine used
MR from Sept 2025 & March 2026 shipments
Suppliers
Govt; UNICEF; Gavi; WHO
NGOs
Local NGOs, community health workers
Coverage claim
81% of target children vaccinated
Analysis
This campaign was a rapid, large‑scale response to the outbreak, targeting over 1.2 million children in high‑risk districts before expanding nationwide. The use of MR vaccines from the Gavi‑approved shipments confirms that vaccine supply was secured and strategically deployed.
The Health Minister’s claim of 81% coverage further dismantles the misconception of vaccine inadequacy. Achieving such coverage amid political unrest demonstrates the resilience of Bangladesh’s immunization system. The persistence of the outbreak despite this campaign points to diagnostic misclassification rather than vaccine failure.
Table 4 – MR vs MMR In Bangladesh
Aspect
MR (EPI)
MMR (outside EPI)
Status
Official national vaccine
Private/NGO use
Schedule
MR1 at 9 months; MR2 at 15 months
Varies by provider
Coverage data
Reported via EPI
No consolidated statistics
Suppliers
UNICEF; WHO‑prequalified manufacturers; Gavi
Private importers
Partners
Govt; UNICEF; WHO; Gavi; NGOs
Hospitals, clinics, NGOs
Analysis
This table clarifies the distinction between MR and MMR in Bangladesh. MR is the official vaccine included in the national EPI schedule, procured through UNICEF and financed by Gavi, with coverage data systematically reported at the national level. By contrast, MMR exists outside the EPI framework, used primarily in private hospitals, clinics, and some NGOs. Its schedules vary by provider, and there is no consolidated national dataset to measure uptake. This distinction is critical because it shows that Bangladesh’s measles protection strategy is anchored in MR, not MMR, and that the official immunization program has maintained continuity and accountability.
The misconception that Bangladesh’s outbreak reflects inadequate vaccination often arises from conflating MR and MMR. Critics point to gaps in MMR coverage, but this ignores the fact that MR is the nationally endorsed vaccine, with consistent supply and financing through global partners. The absence of consolidated MMR statistics does not equate to a failure of measles immunization; rather, it reflects the private nature of MMR distribution. By highlighting the distinction between MR and MMR, this table reinforces the argument that Bangladesh’s outbreak cannot be attributed to vaccination gaps, but instead to diagnostic ambiguity and narrative bias.
Table 1: Epicenter Outbreak Burden (Jan–May 2026)
District/City
Infections (Suspected + Confirmed)
Deaths (Measles + MLS)
Notes
Dhaka
~8,263 suspected cases
~70 deaths
Epicenter; slum clusters most affected
Rajshahi
~3,747 suspected cases
~40 deaths
Northwestern hotspot
Chattogram
~2,514 suspected cases
~30 deaths
Includes Hill Tracts
Khulna
~1,568 suspected cases
~20 deaths
Industrial + rural spread
Others
Hundreds each
8–15 deaths each
Peripheral clusters
Analysis
Dhaka’s dominance in both infections and deaths underscores the paradox of biosafety concentration. Despite hosting sovereign laboratories such as icddr,b, IEDCR, and NTRL, the city became the epicenter of diagnostic ambiguity. The clustering of cases in slum areas highlights the role of density, poverty, and fragile immunization coverage, but also raises questions about why advanced laboratory infrastructure failed to prevent narrative collapse.
The deaths attributed to “measles and MLS” complicate interpretation. Measles is highly contagious, yet MLS cases clustered exclusively in children under five, aligning more closely with Kawasaki disease. This mismatch between epidemiological expectation and observed reality underscores systemic diagnostic failure. The outbreak burden table thus serves as evidence that ambiguous pediatric crises can be misread or misused, amplifying biosecurity risks.
Table 2: Bangladesh’s BSL‑3 Laboratories And Global Partnerships
Facility / Partnership
Year & Place
Authority / Partner(s)
Focus Area & Purpose
icddr,b BSL‑3 Lab
2012, Dhaka
USDA, CDC, NIH, USAID
Cholera, Nipah virus, emerging pathogen research
Sylhet BSL‑3 Lab (CDH)
2016, Sylhet
USAID, The Global Fund
Rapid diagnosis of drug‑resistant TB
MORU Field Labs
2014, Chittagong Hill Tracts
University of Oxford
Tropical disease surveillance
NTP
2015, Dhaka
USAID, Challenge TB
TB diagnostics and reference services
NRL‑AI
2010, Savar
BLRI
H5N1 avian influenza surveillance
IEDCR Reference Labs
2013, Dhaka
IEDCR
Emerging infectious disease surveillance
NTRL (Mohakhali)
2014, Dhaka
NIDCH
TB reference laboratory
Incepta Vaccines Ltd
2021, Dhaka
Sinopharm (China)
Vaccine production
icddr,b – Sinovac Biotech
2021, Dhaka
Sinovac (China)
CoronaVac trials
icddr,b – IMBCAMS (CAS)
2021, Dhaka
CAS (China)
Vaccine trials
DGHS – Kunming Medical University MoU
2026, Dhaka
Kunming Medical University (China)
Healthcare cooperation
Analysis
This table reveals Bangladesh’s dense BSL‑3 infrastructure, distributed across Dhaka, Sylhet, Savar, and the Hill Tracts. Early investments leaned heavily on Western partners, focusing on tuberculosis, avian influenza, and tropical disease surveillance. These collaborations provided foundational biosafety capacity but entrenched dependency on external actors. Sovereign institutions like BLRI and NIDCH attempted to assert national ownership, yet the overall system remained hybrid, reliant on foreign partnerships.
From 2021 onward, Bangladesh pivoted toward Chinese partnerships, particularly in vaccine production and clinical trials. Incepta’s Sinopharm collaboration and icddr,b’s trials with Sinovac and IMBCAMS illustrate this eastward shift. However, the absence of BSL‑4 infrastructure leaves Bangladesh vulnerable to high‑fatality pathogens. The juxtaposition of sovereign ambition with external reliance underscores a paradox: Bangladesh has built a dense network of BSL‑3 laboratories, but without the highest containment tier, its biosafety system remains structurally fragile and susceptible to exploitation in biosecurity contexts.
Table 3: Consolidated Clinical, Diagnostic, Vaccine, And Biosafety Distinctions
This table integrates clinical, diagnostic, vaccine, and biosafety dimensions. MLS cases diverged sharply from measles in age distribution, prodrome, rash, and infectiousness, aligning instead with Kawasaki disease. Diagnostic tools such as PCR and IgM failed to provide clarity, while vaccine surveillance signals revealed temporal overlaps with KD. Together, these distinctions show that the outbreak narrative was structurally misaligned with measles, delaying appropriate interventions.
The biosafety landscape amplifies this misalignment. Dhaka’s concentration of BSL‑3 laboratories, without BSL‑4 capacity, creates a fragile diagnostic ecosystem vulnerable to contamination, misclassification, and dual‑use pressures. The overlap between immunization schedules and MLS incidence further complicates attribution, raising the possibility that pediatric crises could mask bio‑warfare agents. The consolidated table crystallizes the thesis: Bangladesh’s MLS outbreak was not measles, but a misclassified syndrome intersecting with sovereign laboratory vulnerabilities.
Conclusion
Bangladesh’s 2026 pediatric crisis cannot be understood as a simple measles resurgence caused by inadequate vaccination. This article demonstrates that routine immunization continued uninterrupted from January 2024 to May 2026, with MR vaccination achieving 81% coverage during the special campaign. It also shows that the outbreak was misclassified, with MLS cases aligning more closely with Kawasaki disease than measles, and diagnostic ambiguity persisting despite Dhaka’s concentration of sovereign BSL‑3 laboratories.
Together, the evidence dismantles two misconceptions: that Bangladesh failed to vaccinate, and that the outbreak was measles. Instead, the crisis reflects systemic diagnostic fragility, narrative bias, and biosecurity vulnerability. Laboratory presence alone does not guarantee diagnostic clarity, nor does vaccine continuity prevent misclassification. To safeguard public health and national security, Bangladesh must strengthen diagnostic governance, decentralize laboratory reach, and confront structural biases in outbreak framing.
The lesson is clear: Bangladesh’s crisis was not a failure of vaccination, but a failure of narrative. By reframing the outbreak as a misclassified syndrome rather than a measles resurgence, we expose the deeper vulnerabilities of biosafety infrastructure and highlight the urgent need for sovereign diagnostic clarity.
Bangladesh’s 2026 measles and measles‑like symptoms (MLS) outbreak represents a paradox at the intersection of biosafety infrastructure and diagnostic fragility. Centered in Dhaka, the epicenter of sovereign BSL‑3 laboratories — icddr,b, IEDCR, NTRL, and vaccine partnerships with China — the outbreak produced the highest burden of infections and deaths, yet remained diagnostically ambiguous. MLS cases disproportionately affected children under five, aligning more closely with Kawasaki disease than measles, thereby exposing systemic misclassification. This article argues that the outbreak cannot be understood as a simple resurgence of measles. Instead, the convergence of outbreak burden, laboratory concentration, and diagnostic ambiguity suggests the possibility of bio‑warfare exploitation. Through three structured tables — outbreak geography, laboratory infrastructure, and consolidated distinctions — we demonstrate how Bangladesh’s sovereign biosafety hub paradoxically became the site of narrative failure. The analysis reveals that laboratory presence alone does not guarantee diagnostic clarity, and that fragile governance and narrative bias create fertile ground for misdirection. In a geopolitically tense region, the MLS crisis illustrates how pediatric outbreaks can be weaponized as cover for bio‑warfare agents. The conclusion calls for sovereign diagnostic clarity, decentralized laboratory reach, and vigilance against the misuse of outbreak narratives.
Introduction
Outbreaks are not isolated biological events; they are mirrors reflecting the strength and weakness of national biosafety systems. Bangladesh’s 2026 measles/MLS crisis, with Dhaka as its epicenter, revealed a profound paradox: the very city that hosts the country’s most advanced BSL‑3 laboratories also produced the most ambiguous outbreak narrative. Measles, a clinically unambiguous disease, was conflated with MLS — a vague construct that obscured the true nature of pediatric rash‑fever illnesses. This dual framing raises questions not only about diagnostic certainty but also about the potential exploitation of ambiguity in biosecurity contexts.
Bangladesh’s biosafety landscape is characterized by sovereign BSL‑3 laboratories, vaccine partnerships, and surveillance networks. Yet the absence of BSL‑4 capacity, combined with fragile diagnostic governance, leaves the country vulnerable to both misclassification and geopolitical manipulation. The MLS crisis demonstrates how outbreaks can be simultaneously biological, infrastructural, and political. By examining outbreak data, laboratory infrastructure, and consolidated distinctions, this article argues that Bangladesh’s epicenter embodies a dangerous convergence: sovereign laboratory strength coexisting with systemic diagnostic weakness. This convergence raises the possibility that pediatric crises could serve as cover for bio‑warfare agents, whether through misclassification or deliberate exploitation.
Tables Of Convergence: Outbreak Burden, Laboratory Infrastructure, And Diagnostic Ambiguity
Table 1: Epicenter Outbreak Burden (Jan–May 2026)
District/City
Infections (Suspected + Confirmed)
Deaths (Measles + MLS)
Notes
Dhaka
~8,263 suspected cases
~70 deaths
Epicenter; slum clusters most affected
Rajshahi
~3,747 suspected cases
~40 deaths
Northwestern hotspot
Chattogram
~2,514 suspected cases
~30 deaths
Includes Hill Tracts
Khulna
~1,568 suspected cases
~20 deaths
Industrial + rural spread
Others (Sylhet, Pabna, Natore, Chapainawabganj, Hill Tracts)
Hundreds each
8–15 deaths each
Peripheral clusters
Analysis
Dhaka’s dominance in infections and deaths underscores the paradox of biosafety concentration. Despite hosting sovereign laboratories, the city became the epicenter of diagnostic ambiguity. The clustering of cases in slum areas highlights the role of density, poverty, and fragile immunization coverage, but also raises questions about why advanced laboratory infrastructure failed to prevent narrative collapse.
The deaths attributed to “measles and MLS” complicate interpretation. Measles is highly contagious, yet MLS cases clustered exclusively in children under five, aligning more closely with Kawasaki disease. This mismatch between epidemiological expectation and observed reality underscores systemic diagnostic failure. The outbreak burden table thus serves as evidence that ambiguous pediatric crises can be misread or misused, amplifying biosecurity risks.
Table 2: Bangladesh’s BSL‑3 Laboratories And Global Partnerships
Facility / Partnership
Year & Place
Authority / Partner(s)
Focus Area & Purpose
icddr,b BSL‑3 Lab
2012, Dhaka
USDA, CDC, NIH, USAID
Cholera, Nipah virus, emerging pathogen research
Sylhet BSL‑3 Lab (CDH)
2016, Sylhet
USAID, The Global Fund
Prefabricated lab for rapid diagnosis of drug‑resistant TB
MORU Field Labs
2014, Chittagong Hill Tracts
University of Oxford (UK)
Surveillance of tropical infectious diseases
National Tuberculosis Control Program (NTP)
2015, Dhaka
USAID, Challenge TB
Capacity building for TB diagnostics and reference services
National Reference Laboratory for Avian Influenza (NRL‑AI)
2010, Savar
BLRI
Surveillance and research on H5N1 avian influenza
IEDCR Reference Labs
2013, Dhaka
IEDCR
National surveillance for emerging infectious diseases
NTRL (Mohakhali)
2014, Dhaka
NIDCH
National TB Reference Laboratory, sovereign confirmation
Incepta Vaccines Ltd
2021, Dhaka
Sinopharm (China)
Local production of Sinopharm vaccine (5M doses/month)
This consolidated table reveals that Bangladesh’s BSL‑3 infrastructure is geographically distributed, with facilities in Dhaka, Sylhet, Savar, and the Chittagong Hill Tracts. Early investments (2010–2016) leaned heavily on Western partners such as the CDC, NIH, USAID, and Oxford University, focusing on tuberculosis, avian influenza, and tropical disease surveillance. These collaborations provided Bangladesh with foundational biosafety capacity, but they also entrenched dependency on external actors. The presence of sovereign institutions like BLRI and NIDCH demonstrates attempts at national ownership, yet the overall pattern shows a hybrid system where foreign partnerships remain central to laboratory development and disease surveillance.
From 2021 onward, the table highlights a strategic pivot toward Chinese partnerships, particularly in vaccine production and clinical trials. Incepta’s Sinopharm collaboration, icddr,b’s trials with Sinovac and IMBCAMS, and the 2026 Kunming MoU illustrate how Bangladesh’s biosafety landscape has shifted eastward. This transition reflects both geopolitical realignment and practical necessity, as China offered rapid vaccine technology transfer during the COVID‑19 era. However, the absence of BSL‑4 infrastructure leaves Bangladesh vulnerable to high‑fatality pathogens like Nipah and H5N1, even as BSL‑3 labs proliferate. The juxtaposition of sovereign ambition with external reliance underscores a paradox: Bangladesh has built a dense network of BSL‑3 laboratories, but without the highest containment tier, its biosafety system remains structurally fragile and susceptible to exploitation in biosecurity contexts.
Table 3: Consolidated Clinical, Diagnostic, Vaccine, And Biosafety Distinctions
Category
Aspect
Details
Implications
Clinical Features
Age Distribution
Measles: Children & adults Kawasaki Disease (KD): Primarily <5 years
This consolidated table integrates clinical, diagnostic, vaccine, and biosafety dimensions into a single framework. It demonstrates that MLS cases diverge sharply from measles in age distribution, prodrome, rash, and infectiousness, aligning instead with Kawasaki disease. Diagnostic tools such as PCR and IgM fail to provide clarity, while vaccine surveillance signals reveal temporal overlaps with KD. Together, these distinctions show that the outbreak narrative was structurally misaligned with measles, delaying appropriate interventions and obscuring the true nature of the crisis.
The biosafety landscape amplifies this misalignment. Dhaka’s concentration of BSL‑3 laboratories, without BSL‑4 capacity, creates a fragile diagnostic ecosystem vulnerable to contamination, misclassification, and dual‑use pressures. The overlap between immunization schedules and MLS incidence further complicates attribution, raising the possibility that pediatric crises could mask bio‑warfare agents. The consolidated table thus crystallizes the thesis: Bangladesh’s MLS outbreak was not measles, but a misclassified syndrome intersecting with sovereign laboratory vulnerabilities, exposing both public health fragility and biosecurity risks.
Conclusion
Bangladesh’s 2026 measles/MLS crisis cannot be dismissed as a routine outbreak. The evidence presented across the three tables — outbreak burden, sovereign BSL‑3 laboratory infrastructure, and consolidated distinctions — demonstrates a coherent pattern: the epicenter of sovereign biosafety strength simultaneously became the epicenter of diagnostic failure. Dhaka, with its concentration of icddr,b, IEDCR, NTRL, and vaccine partnerships, should have been the site of clarity and containment. Instead, it produced the most ambiguous narrative, conflating measles with MLS and obscuring the true nature of pediatric rash‑fever illnesses.
The consolidated distinctions show that MLS cases aligned far more closely with Kawasaki disease than measles, diverging in age distribution, prodrome, rash, infectiousness, and complications. Diagnostic tools such as PCR and IgM failed to provide certainty, while vaccine surveillance signals revealed temporal overlaps with KD. The biosafety landscape, dominated by BSL‑3 laboratories but lacking BSL‑4 capacity, amplified this fragility. Together, these factors point to a deeper vulnerability: the possibility that ambiguous pediatric crises could mask or be exploited as bio‑warfare signals.
This convergence of outbreak burden, laboratory concentration, and diagnostic ambiguity is not accidental. It reflects structural weaknesses in governance, narrative bias, and reliance on centralized laboratory hubs. In a region marked by geopolitical tensions and allegations of dual‑use research, the MLS crisis illustrates how sovereign biosafety investments can paradoxically create fertile ground for misdirection. The outbreak’s framing as “measles” concealed the reality of a misclassified syndrome, while simultaneously raising the specter of deliberate exploitation.
The lesson is clear: laboratory presence alone does not guarantee diagnostic certainty, nor does it prevent systemic failures in outbreak response. To safeguard children and national security alike, Bangladesh must strengthen sovereign diagnostic clarity, decentralize laboratory reach beyond Dhaka, and confront the structural biases that perpetuate misclassification. Only by bridging the gap between biosafety infrastructure and outbreak realities can Bangladesh transform its paradox into resilience.
The MLS crisis should therefore be understood not only as a public health tragedy but as a biosecurity warning — a signal that ambiguous pediatric outbreaks, when occurring in the shadow of sovereign BSL‑3 laboratories, may represent more than misclassification. They may be the masked face of bio‑warfare in South Asia.
Bangladesh’s biosafety landscape is characterized by a paradox: the country has invested heavily in BSL-3 laboratories, supported by international collaborations, yet it lacks any operational BSL-4 facilities. This absence has profound implications for national and regional biosecurity, particularly given Bangladesh’s endemic exposure to high-risk pathogens such as Nipah virus and Avian Influenza H5N1. This article explores the historical trajectory of Bangladesh’s BSL-3 infrastructure, its reliance on global partnerships, and the gradual shift toward independent management. It also examines vaccine-related collaborations with China, situating them within broader geopolitical dynamics of biosafety and biosecurity. Through a detailed analysis of key laboratory facilities and partnerships, the article argues that Bangladesh’s biosafety system is both strengthened and constrained by its dependence on external actors. The conclusion highlights the urgent need for sovereign capacity-building to ensure compliance with international standards while safeguarding against potential misuse of gain-of-function research.
Introduction
The global biosafety architecture is unevenly distributed, with advanced containment facilities concentrated in a handful of countries. Bangladesh, despite being a hotspot for zoonotic diseases, remains without a BSL-4 laboratory. Instead, the country has developed a network of BSL-3 laboratories, many of which were established through international partnerships. These laboratories serve as critical nodes for surveillance, diagnostics, and vaccine research, but their limitations are evident when handling pathogens requiring extreme containment.
This article provides a holistic overview of Bangladesh’s biosafety infrastructure, tracing the evolution of its BSL-3 laboratories, their global linkages, and the gradual emergence of independent management. It also situates Bangladesh’s collaborations with China within the broader geopolitical context of biosafety in South Asia, contrasting them with Pakistan’s controversial BSL-4 developments. By analyzing the establishment, purpose, and operational focus of these laboratories, the article seeks to illuminate both the strengths and vulnerabilities of Bangladesh’s biosafety system.
Tables Of Trust And Technology: Mapping Bangladesh’s BSL-3 Landscape
Before delving into the analysis, it is essential to present the refined tables that capture the chronology, geography, and purpose of Bangladesh’s BSL-3 laboratories. These tables highlight the dual trajectory of international partnerships and independent national initiatives, as well as the vaccine-related collaborations with China that have shaped recent biosafety developments.
Table 1: Global Partnerships And Tie-ups (BSL-3)
Facility Name
Year & Place of Establishment
Global Partner(s)
Primary Purpose & Features
icddr,b BSL-3 Lab
2012, Dhaka
USDA, CDC, NIH, USAID
Research on cholera, Nipah virus, and emerging pathogens.
Sylhet BSL-3 Lab (CDH)
2016, Sylhet
USAID, The Global Fund
Prefabricated lab for rapid diagnosis of drug-resistant TB.
MORU Field Labs
2014, Chittagong Hill Tracts
University of Oxford (UK)
Surveillance of tropical infectious diseases.
National Tuberculosis Control Program (NTP)
2015, Dhaka
USAID, Challenge TB
Capacity building for TB diagnostics and reference services.
Analysis
The establishment of these laboratories reflects Bangladesh’s reliance on Western partners for biosafety infrastructure. The icddr,b BSL-3 lab, inaugurated in 2012, stands as a flagship facility, symbolizing the country’s entry into advanced pathogen research. Its collaborations with the CDC and NIH underscore the global stakes of cholera and Nipah virus surveillance. Similarly, the Sylhet prefabricated lab, commissioned in 2016, demonstrates how containerized solutions can rapidly expand diagnostic capacity in resource-constrained settings.
The MORU field labs and NTP facilities highlight the integration of Bangladesh into global disease surveillance networks. By embedding itself within Oxford’s tropical medicine research unit, Bangladesh gained access to cutting-edge methodologies. The NTP’s expansion in 2015, supported by USAID, reflects a strategic focus on tuberculosis, a disease of both national and global concern. Together, these facilities illustrate how international partnerships have been instrumental in shaping Bangladesh’s biosafety trajectory.
Table 2: Independently Managed BSL-3 Laboratories
Facility/Agency
Year & Place of Establishment
Management Authority
Focus Area & Purpose
National Reference Laboratory for Avian Influenza (NRL-AI)
2010, Savar
BLRI
Surveillance and research on H5N1.
IEDCR Reference Labs
2013, Dhaka
IEDCR
National surveillance for emerging infectious diseases.
NTRL (Mohakhali)
2014, Dhaka
NIDCH
National TB Reference Laboratory.
Analysis
The independently managed laboratories mark a significant shift toward sovereign biosafety capacity. The NRL-AI, established in 2010, was a direct response to the endemic threat of avian influenza in Bangladesh’s poultry industry. Managed by BLRI, it reflects the country’s ability to mobilize domestic expertise for pathogen surveillance. The IEDCR labs, expanded in 2013, serve as the national frontline for outbreak response, underscoring the importance of domestic control over biosafety infrastructure.
The NTRL in Mohakhali, established in 2014, represents a consolidation of TB diagnostics under national authority. Unlike the globally supported NTP facilities, the NTRL is a sovereign reference laboratory, ensuring final confirmation of TB cases. Collectively, these laboratories demonstrate Bangladesh’s gradual move from dependence to independence, though challenges remain in terms of resources, training, and compliance with international standards.
Local production of Sinopharm vaccine (5M doses/month).
icddr,b
2021, Dhaka
Sinovac Biotech
Phase-3 trials for CoronaVac.
icddr,b
2021, Dhaka
IMBCAMS (CAS)
Phase-3 trials for CAS vaccine.
DGHS
2026, Dhaka
Kunming Medical University
Healthcare cooperation and potential vaccine co-production.
Analysis
The vaccine-related partnerships with China represent a new phase in Bangladesh’s biosafety evolution. Incepta’s 2021 agreement with Sinopharm enabled local production of COVID-19 vaccines, leveraging BSL-3 containment for fill-and-finish operations. This marked a significant step toward self-sufficiency in vaccine manufacturing. Similarly, icddr,b’s collaborations with Sinovac and IMBCAMS facilitated Phase-3 trials, embedding Bangladesh within global vaccine research networks.
The DGHS’s 2026 MoU with Kunming Medical University signals a broader healthcare cooperation agenda, extending beyond COVID-19 to future vaccine co-production. These partnerships highlight China’s growing role in Bangladesh’s biosafety landscape, contrasting with the earlier dominance of Western actors. While they enhance Bangladesh’s manufacturing capacity, they also raise questions about dependency and transparency, particularly in the context of regional biosecurity dynamics involving Pakistan.
Conclusion
Bangladesh’s biosafety infrastructure is a story of progress and paradox. The country has built a robust network of BSL-3 laboratories, initially through international partnerships and increasingly through independent management. These facilities have enabled critical surveillance and diagnostics for pathogens of national and global concern. Yet the absence of a BSL-4 laboratory remains a glaring vulnerability, particularly given Bangladesh’s exposure to high-fatality zoonotic diseases.
The vaccine-related collaborations with China illustrate both opportunity and risk. They expand Bangladesh’s manufacturing capacity and embed it within global research networks, but they also deepen dependency on external actors. In contrast to Pakistan’s controversial BSL-4 developments, Bangladesh’s biosafety trajectory remains defensive and public health-oriented. The challenge ahead lies in consolidating sovereign capacity, ensuring compliance with international standards, and navigating the geopolitical complexities of biosafety partnerships. Ultimately, Bangladesh’s biosafety future will depend on balancing global collaboration with national independence, safeguarding both public health and regional security.
Bangladesh’s recent reports of deaths attributed to “measles and measles‑like symptoms (MLS)” expose a dangerous diagnostic ambiguity. Measles is a clinically unambiguous disease with hallmark features and predictable transmission dynamics. MLS, however, is a vague construct that obscures the true nature of pediatric rash‑fever illnesses. This article argues that the dual use of “measles and MLS” is itself evidence of misclassification and misdirection. Drawing on comparative clinical data, laboratory diagnostic limitations, vaccine‑surveillance signals, biosafety vulnerabilities, and Bangladesh’s national immunization schedule, we demonstrate that MLS aligns more closely with Kawasaki disease (KD) than measles. Misdiagnosis delays appropriate treatment, particularly intravenous immunoglobulin for KD, increasing the risk of preventable deaths. Through structured tables and extended analyses, we show how MLS functions as a structural smokescreen that conceals systemic failures. We conclude that Bangladesh’s MLS crisis is not a measles resurgence but a convergence of diagnostic blind spots, vaccine‑era surveillance signals, and fragile biosafety governance. Recognizing this truth is essential to restoring public trust and preventing further loss of life.
Introduction
Outbreak reporting depends on clarity. Measles, one of the most contagious viral diseases, has a well‑defined clinical profile: fever, cough, coryza, conjunctivitis, Koplik spots, and a descending rash. Its epidemiology is equally clear, affecting both children and adults in unvaccinated populations. There is no diagnostic gray zone.
Yet Bangladesh’s health authorities have reported deaths from “measles and measles‑like symptoms (MLS).” This dual framing raises immediate red flags. MLS is not a recognized disease entity; it is a vague label that masks uncertainty. By conflating claimed confirmed measles with MLS, officials blur the line between evidence and assumption, creating a narrative that is neither scientifically rigorous nor clinically safe.
This article applies a holistic lens to the MLS phenomenon. We examine clinical distinctions between measles and Kawasaki disease, the limitations of PCR and IgM assays, vaccine‑surveillance signals that document KD associations, biosafety vulnerabilities that amplify diagnostic ambiguity, and Bangladesh’s dense immunization schedule. Through structured tables and extended analyses, we argue that MLS is not measles, but a misclassified pediatric vasculitis crisis. The stakes are high: without proper diagnosis and treatment, children will continue to die unnecessarily.
Bangladesh’s Measles‑Like Symptoms (MLS) Crisis Is Not Measles
Table 1 — When Symptoms Deceive: Distinguishing Measles From Kawasaki Disease
Measles is defined by a specific prodrome and rapid household transmission, neither of which are consistently observed in Bangladesh’s MLS cases. Instead, the epidemiological pattern shows strict pediatric concentration, mirroring Kawasaki disease’s age distribution. This mismatch undermines the measles narrative and points to systemic misclassification.
The consequences of misdiagnosis are profound. Measles complications include pneumonia and encephalitis, while Kawasaki disease carries the risk of coronary artery aneurysms and myocarditis. Treating KD as measles delays life‑saving interventions such as IVIG. Thus, the MLS label is not a harmless shorthand but a dangerous distortion that endangers children’s lives.
Table 2 — The Illusion Of Certainty: Why PCR And IgM Cannot Resolve MLS
Test
Intended Purpose
Limitations
PCR
Detect viral genetic material
Amplifies fragments, not live virus; contamination risk; false positives
PCR’s sensitivity is both its strength and weakness. It can detect minute fragments of viral material, but cannot distinguish between live virus and residual genetic debris. In low‑biosafety settings, contamination risks are high, making false positives likely. In MLS cases, PCR positivity may reflect contamination or past infection, not active measles transmission.
IgM assays add further uncertainty. Cross‑reactivity with unrelated pathogens produces false positives, while timing variability undermines reliability. When PCR and IgM are combined, they provide suggestive but not definitive evidence. Treating these results as proof of measles is a diagnostic fallacy that perpetuates misclassification and delays appropriate care.
Table 3 — Signals In The System: Kawasaki Disease Across Global Vaccine Surveillance Networks
Vaccine Category
Specific Vaccines
Nature of Association
Rotavirus
RotaTeq, Rotarix
KD listed in FDA labels due to trial imbalances
Pneumococcal
PCV13, Pneumo 23
Case reports in surveillance systems
Combination
DTaP‑IPV‑HepB‑Hib
KD reports in VAERS
Others
Influenza, MMR, BCG
Temporal KD occurrences
Analysis
Global surveillance systems consistently document KD occurrences temporally associated with vaccines. Regulatory agencies such as the FDA list KD in rotavirus vaccine labels, while VAERS contains KD reports across multiple categories. These signals cannot be dismissed as anecdotal; they highlight the need for careful interpretation of pediatric rash‑fever illnesses during immunization campaigns.
In Bangladesh, MLS cases occur exclusively in young children — the same demographic most affected by KD. The overlap between vaccination schedules and KD incidence makes misclassification plausible. MLS may thus represent KD clustering during mass immunization, not measles resurgence. Ignoring these signals perpetuates diagnostic blind spots and undermines public trust.
Bangladesh’s biosafety infrastructure is fragile. Limited BSL‑3/4 capacity forces reliance on external laboratories, while ambiguous “BSL‑2+” designations create containment mismatches. In such an environment, diagnostic certainty is compromised, amplifying the risk of misclassification.
Regional dynamics further complicate the picture. Allegations of dual‑use research in neighboring countries heighten biosecurity pressures. In this context, MLS must be understood not as a simple outbreak but as a structural phenomenon shaped by biosafety vulnerabilities and geopolitical dynamics.
Table 5 — The Immunization Landscape: Bangladesh’s Pediatric Vaccine Schedule And Key Suppliers
Vaccine
Timing
Protects Against
Partners & Suppliers
BCG
At birth
Tuberculosis
UNICEF, WHO
OPV
6, 10, 14 weeks
Polio
Global Polio Eradication partners
Pentavalent (DTP–HepB–Hib)
6, 10, 14 weeks
Diphtheria, tetanus, pertussis, hepatitis B, Hib
Gavi, UNICEF, WHO, SII among major suppliers
PCV
6, 10, 18 weeks
Pneumococcal disease
UNICEF, WHO
Rotavirus
6, 10, 14 weeks
Rotavirus diarrhea
Gavi, UNICEF, WHO, SII supplies certain formulations
MR (Measles–Rubella)
9 & 15 months
Measles, Rubella
Serum Institute of India (SII) via UNICEF, WHO, Gavi
Td
School‑age children, pregnant women
Tetanus, diphtheria
UNICEF, WHO
Analysis
Bangladesh’s immunization program is heavily dependent on international procurement. Beyond MR vaccines, SII contributes to pentavalent, rotavirus, and other formulations supplied through UNICEF and WHO channels. This means that the majority of vaccines administered in the critical 0–18 month window — the same period in which MLS cases cluster — are linked to SII’s production lines. The overlap between vaccine timing and MLS incidence underscores the structural ambiguity in outbreak interpretation.
The continuous administration of MR1 and MR2 from 9 to 15 months coincides directly with MLS reports. When combined with other SII‑linked vaccines in the early schedule, this creates multiple temporal windows for Kawasaki disease to appear. The institutional emphasis on measles elimination — reinforced by UNICEF, WHO, and Gavi — biases diagnostic interpretation toward measles, even when the clinical picture does not align. This systemic bias effectively sidelines Kawasaki disease recognition, leaving children vulnerable to misdiagnosis and deprived of timely interventions such as IVIG.
Moreover, the reliance on a single narrative — “measles resurgence” — allows authorities to mask structural vulnerabilities in biosafety and diagnostic capacity. By framing ambiguous cases as MLS under the measles banner, officials avoid confronting the deeper issue: Bangladesh’s fragile health infrastructure cannot reliably distinguish between measles and non‑infectious pediatric vasculitis. This narrative convenience comes at a tragic cost, as children with KD are misclassified, untreated, and exposed to preventable cardiac complications. The MLS label thus functions as a diagnostic smokescreen, concealing systemic failures while perpetuating a false sense of certainty.
Conclusion
Bangladesh’s MLS crisis is not measles. The dual use of “measles and MLS” is itself proof of misclassification and misdirection. Clinical evidence shows MLS aligns with Kawasaki disease, not measles. Laboratory diagnostics, particularly PCR and IgM, cannot resolve the ambiguity. Vaccine‑surveillance signals document KD associations across multiple categories, complicating outbreak interpretation. Biosafety vulnerabilities and a dense immunization schedule — supplied by major partners including UNICEF, WHO, Gavi, and the Serum Institute of India (SII)*— further amplify uncertainty.
The danger is clear: misdiagnosis delays appropriate treatment, leading to preventable deaths. MLS is not a harmless label; it is a structural smokescreen that conceals systemic failures. To protect children and restore public trust, Bangladesh must move beyond the banner of measles. Independent diagnostic verification, strengthened biosafety governance, and transparent reporting are essential. Only then can the truth be acknowledged — and lives saved.
Bangladesh’s recent surge in “measles‑like symptoms” (MLS) has been widely interpreted as a resurgence of measles, yet the clinical, epidemiological, and biosurveillance evidence reveals a far more complex picture. This article applies the Vaccine‑Based Herd Immunity (VBHI) Pseudoscience Framework analytical framework to examine how diagnostic ambiguity, vaccine‑era surveillance signals, and biosafety constraints converge to shape outbreak interpretation. Drawing on comparative clinical data, laboratory diagnostic limitations, global vaccine‑surveillance patterns, and Bangladesh’s national immunization schedule, we argue that MLS cannot be understood solely as an infectious‑disease phenomenon. Instead, it reflects a structural interplay between pediatric vasculitis (notably Kawasaki disease), high‑volume immunization campaigns, PCR/IgM interpretive pitfalls, and systemic biosafety vulnerabilities.
The analysis demonstrates that MLS cases align more closely with Kawasaki disease than measles in age distribution, symptom profile, and epidemiological behavior. Vaccine‑surveillance systems across multiple countries document Kawasaki disease temporally associated with rotavirus, pneumococcal, DTaP‑containing, and measles‑containing vaccines, complicating interpretation during mass immunization periods. Bangladesh’s biosafety landscape — characterized by limited BSL‑3/4 capacity, reliance on external laboratories, and regional geopolitical pressures — further amplifies diagnostic uncertainty. The VBHI framework reveals how structural vulnerabilities, rather than a single pathogen, can generate a cascade of misclassification, miscommunication, and public‑health confusion. We conclude that MLS represents a convergence of biosurveillance blind spots, pediatric immunology, and infrastructural fragility, underscoring the need for independent diagnostic verification, strengthened biosafety governance, and transparent outbreak investigation.
Introduction
Outbreak interpretation in low‑resource settings is rarely a straightforward matter of pathogen detection. Instead, it emerges from the intersection of clinical presentation, laboratory capacity, biosurveillance systems, and geopolitical context. Bangladesh’s recent wave of “measles‑like symptoms” (MLS) illustrates this complexity. While early reports framed the phenomenon as a measles resurgence, closer examination reveals inconsistencies: the absence of adult cases, the lack of classic measles prodrome, the limited evidence of household transmission, and the reliance on PCR/IgM assays with known interpretive limitations.
This article applies the Vaccine‑Based Herd Immunity (VBHI) Pseudoscience Framework to analyze MLS as a systemic phenomenon rather than a single‑pathogen outbreak. The VBHI framework emphasizes how vaccine schedules, biosurveillance signals, health‑system capacity, and infrastructural vulnerabilities interact to shape diagnostic narratives. In Bangladesh, these interactions are particularly salient: a dense pediatric vaccination schedule, high‑volume MR campaigns, biosafety constraints, and regional dual‑use research dynamics create an environment where diagnostic ambiguity can flourish.
We synthesize clinical comparisons, laboratory diagnostic critiques, vaccine‑surveillance data, and national immunization schedules to argue that MLS aligns more closely with Kawasaki disease (KD) — a pediatric vasculitis known to appear in vaccine‑surveillance systems — than with measles. We further examine how biosafety gaps and geopolitical pressures influence outbreak interpretation. The goal is not to assign blame but to illuminate how structural vulnerabilities can distort public‑health narratives, leading to misclassification and misdirected responses.
Bangladesh’s Measles Death Fiasco Is A Pandemic Of Vaccines And Bio-Warfare Agent
Section 1 — Clinical Ambiguity and the Measles–Kawasaki Overlap
Before presenting the table, it is essential to understand why clinical comparison is foundational to the MLS debate. Both measles and Kawasaki disease present with fever and rash, yet their underlying mechanisms, epidemiology, and complications diverge sharply. In Bangladesh, where MLS cases occur exclusively in young children and lack hallmark measles features, clinical differentiation becomes critical.
Table 1: When Symptoms Deceive: Distinguishing Measles From Kawasaki Disease In The MLS Context
The clinical distinctions between measles and Kawasaki disease reveal why MLS cannot be assumed to represent measles without rigorous diagnostic confirmation. Measles is defined by a highly specific prodrome — cough, coryza, conjunctivitis, and Koplik spots — followed by a descending rash and rapid household transmission. None of these features are consistently observed in Bangladesh’s MLS cases. Instead, the epidemiological pattern shows a strict pediatric concentration, with no adult involvement, which contradicts measles transmission dynamics but aligns precisely with Kawasaki disease’s age distribution. This mismatch between expected measles behavior and observed MLS patterns raises fundamental questions about the validity of the measles hypothesis.
Furthermore, the complications associated with each condition underscore the stakes of misdiagnosis. Measles can lead to pneumonia and encephalitis, whereas Kawasaki disease carries the risk of coronary artery aneurysms and myocarditis — complications that require entirely different clinical management. Misclassifying KD as measles delays appropriate treatment and increases the risk of long‑term cardiac damage. The reliance on PCR and IgM assays to support the measles narrative is problematic given their known limitations: PCR detects genetic fragments rather than active virus, and IgM assays are prone to cross‑reactivity. Without clinical correlation and epidemiological consistency, these tests cannot conclusively diagnose measles. MLS thus represents a diagnostic blind spot where structural vulnerabilities intersect with clinical ambiguity.
Section 2 — Laboratory Diagnostics Under Scrutiny
Laboratory confirmation is often treated as the gold standard in outbreak settings, yet PCR and IgM assays have inherent limitations that can distort interpretation. In Bangladesh’s MLS context — characterized by high‑throughput testing, limited biosafety capacity, and overlapping immunization campaigns — these limitations become especially consequential.
Table 2: The Illusion Of Certainty: Why PCR And IgM Cannot Resolve MLS
Test
Intended Purpose
Limitations
PCR
Detect viral genetic material
Amplifies fragments, not live virus; contamination risk; false positives
PCR’s sensitivity is both its strength and its Achilles’ heel. While capable of detecting minute quantities of viral genetic material, PCR cannot distinguish between live virus and residual fragments. In settings with limited biosafety infrastructure — such as Bangladesh’s BSL‑1/2 laboratories handling high‑risk samples — contamination risks increase substantially. High‑throughput testing environments amplify the likelihood of false positives, especially when multiple samples are processed simultaneously. In the MLS context, PCR positivity may reflect contamination, past infection, or non‑specific amplification rather than active measles transmission. Without clinical correlation, PCR results can create a false sense of certainty that obscures alternative diagnoses such as Kawasaki disease.
IgM assays introduce additional uncertainty. IgM antibodies can cross‑react with unrelated pathogens, producing false positives, and their timing varies widely among individuals. When PCR and IgM are used together, they provide suggestive but not definitive evidence of measles infection. The tendency to equate detection with proof — a common pitfall in biosurveillance — becomes particularly problematic in low‑resource settings where clinical expertise and diagnostic tools are limited. In Bangladesh, this conflation has contributed to the premature labeling of MLS as measles, despite epidemiological inconsistencies. The MLS phenomenon thus illustrates how laboratory limitations can distort outbreak narratives when not interpreted within a broader clinical and biosafety context.
Section 3 — Vaccine Surveillance And The KD Connection
Kawasaki disease appears in vaccine‑surveillance systems worldwide, complicating the interpretation of pediatric rash‑fever illnesses during immunization campaigns. Understanding these signals is essential for contextualizing MLS within Bangladesh’s dense vaccination schedule.
Table 3: Signals In The System: Kawasaki Disease Across Global Vaccine Surveillance Networks
Vaccine Category
Specific Vaccines
Nature of Association
Rotavirus
RotaTeq, Rotarix, LLR
KD listed in FDA labels due to trial imbalances
Pneumococcal
PCV13, Pneumo 23
Case reports in surveillance systems
Hepatitis
Hepatitis A/B
Individual case reports
Combination
DTaP‑IPV‑HepB‑Hib
KD reports in VAERS
Others
Influenza, MMR, BCG
Temporal KD occurrences
Analysis
The presence of Kawasaki disease in global vaccine‑surveillance systems is well‑documented and cannot be dismissed as anecdotal. Regulatory agencies such as the FDA list KD in rotavirus vaccine labels due to imbalances observed in clinical trials, while passive surveillance systems like VAERS contain KD reports across multiple vaccine categories. These signals highlight the need for careful interpretation of pediatric rash‑fever illnesses during immunization campaigns. In Bangladesh, where MLS cases occur exclusively in young children — the same demographic most affected by KD — the overlap between vaccination schedules and KD incidence becomes particularly relevant. The VBHI framework emphasizes that surveillance signals must be interpreted within their structural context, not in isolation.
Active surveillance registries in Canada, Singapore, Taiwan, the United States, and the United Kingdom provide further evidence of KD clustering within 0–42 days of vaccination. These findings, documented in peer‑reviewed studies and regulatory reports, demonstrate that KD can appear temporally associated with routine immunizations. In Bangladesh, where diagnostic capacity for KD is limited and clinical expertise varies, misclassification is plausible — especially during mass vaccination campaigns. MLS may thus represent a convergence of KD incidence, vaccine‑era surveillance patterns, and diagnostic ambiguity rather than a straightforward measles outbreak.
Section 4 — The MMR Paradox And Immune Modulation
The measles‑containing vaccine occupies a central position in the MLS narrative, yet global surveillance data reveal a paradox: KD clusters occur within days of MMR vaccination. This paradox complicates the interpretation of MLS during Bangladesh’s MR campaigns.
Table 4: The Measles Paradox: Kawasaki Disease Patterns In MMR Surveillance Data
Surveillance Aspect
Findings
Temporal Onset
Median KD onset 8 days post‑MMR
Observed Risk
KD clusters suggest a direct association
Comparison
Fewer KD reports than DTaP or PCV
Diagnostic Certainty
81% complete KD, 14% incomplete KD
Analysis
The MMR–KD paradox underscores the complexity of interpreting pediatric rash‑fever illnesses during measles vaccination campaigns. KD clusters have been documented within days of MMR vaccination, with a median onset of eight days. While the absolute number of KD reports is lower than for DTaP or PCV, the diagnostic certainty is high: 81% of cases meet complete KD criteria. These findings challenge the assumption that measles‑containing vaccines can only prevent measles‑like illnesses; they also highlight the potential for KD to appear temporally associated with MMR. In the MLS context, this paradox becomes particularly salient because Bangladesh administers MR1 and MR2 continuously from 9 to 15 months — the exact age range affected by MLS.
If MLS cases coincide with MR campaigns, they may represent misdiagnosed KD rather than measles. The pediatric‑only pattern of MLS aligns with KD’s age distribution, while the absence of adult cases contradicts measles epidemiology. The reliance on PCR and IgM assays to support the measles hypothesis is problematic given their limitations. The MMR paradox thus reinforces the need for nuanced interpretation of MLS within a broader clinical, epidemiological, and biosurveillance framework. Rather than viewing MLS as a simple measles resurgence, the VBHI framework reveals it as a complex interplay of pediatric immunology, vaccine‑era surveillance signals, and diagnostic uncertainty.
Section 5 — Biosafety, Gain‑Of‑Function, And Regional Dynamics
Bangladesh’s biosafety landscape is shaped by its status as a hotspot for high‑fatality pathogens such as Nipah virus and avian influenza H5N1. Research on these pathogens involves studying viral evolution, transmissibility, and antigenic drift — activities that can intersect with gain‑of‑function concerns. The country’s limited BSL‑3/4 capacity, reliance on external laboratories, and ambiguous “BSL‑2+” designations create structural vulnerabilities that can influence outbreak interpretation. These vulnerabilities are not unique to Bangladesh but reflect broader challenges faced by low‑resource countries navigating global biosecurity pressures.
Regional dynamics further complicate the picture. Pakistan has faced allegations of engaging in dual‑use research with China, including work on high‑risk pathogens in BSL‑4‑equivalent facilities. While Bangladesh maintains compliance with the Biological Weapons Convention, the regional environment underscores the importance of robust biosafety governance. The combination of high‑risk pathogens, containment mismatches, and shifting funding sources creates an environment where diagnostic ambiguity can be amplified. MLS must be understood within this broader context of biosafety capacity, geopolitical dynamics, and global biosecurity pressures.
Section 6 — The National Vaccination Schedule And MLS Interpretation
Bangladesh’s national vaccination schedule reveals a dense cluster of immunizations in the first 18 months of life — the exact age range affected by MLS. Understanding this schedule is essential for contextualizing MLS within the VBHI framework.
Table 5: The Immunization Landscape: Bangladesh’s Pediatric Vaccine Schedule And Its Implications For MLS
Vaccine
When given in EPI
Protects against
Approx. children per year*
Vaccine & supplier
Key partners (incl. NGOs)
BCG
At birth
Tuberculosis
~3.0–3.3 million newborns
BCG from WHO‑prequalified manufacturers via UNICEF Supply Division
Govt of Bangladesh (EPI), UNICEF, WHO, Gavi, local NGOs for outreach
OPV
6, 10, 14 weeks
Poliomyelitis
Same birth cohort; 3 doses
OPV via UNICEF from WHO‑prequalified producers
Govt EPI, Global Polio Eradication partners, NGOs
IPV
14 weeks
Poliomyelitis
Same cohort; 1 dose
IPV via UNICEF
Govt EPI, WHO, NGOs
Pentavalent (DTP–HepB–Hib)
6, 10, 14 weeks
Diphtheria, tetanus, pertussis, hepatitis B, Hib
Same cohort; 3 doses
Pentavalent from WHO‑PQ manufacturers (e.g., large Indian producers) via UNICEF
*Approximate birth cohort; exact 2024–May 2026 dose counts by antigen are not yet fully published.
Analysis
The national vaccination schedule shows that Bangladesh’s pediatric population receives multiple vaccines associated with KD in global surveillance systems — including rotavirus, PCV, and DTaP‑containing vaccines — within the first 18 weeks of life. This creates multiple temporal windows in which KD may appear, particularly in a setting with limited diagnostic capacity. The continuous administration of MR1 and MR2 from 9 to 15 months further complicates interpretation, as MLS cases naturally overlap with MR campaigns. This overlap can create the illusion of a measles outbreak even when the clinical picture does not match measles. The VBHI framework highlights how high‑volume immunization schedules can intersect with pediatric vasculitis to produce diagnostic ambiguity.
The involvement of international partners — including UNICEF, WHO, Gavi, and local NGOs — shapes the diagnostic narrative by emphasizing measles elimination and providing PCR/IgM testing kits. This institutional ecosystem is optimized to detect measles, not Kawasaki disease. As a result, ambiguous cases may default to a measles interpretation even when clinical and epidemiological evidence suggests otherwise. The sheer scale of vaccination — more than three million children per year — increases the likelihood of temporal clustering, further complicating outbreak interpretation. MLS thus reflects the intersection of vaccine‑era surveillance, pediatric immunology, and structural diagnostic vulnerabilities.
Conclusion
Bangladesh’s measles‑like symptom crisis cannot be understood solely through the lens of infectious disease. The VBHI framework reveals MLS as a convergence of diagnostic ambiguity, vaccine‑era surveillance signals, biosafety vulnerabilities, and geopolitical pressures. Clinical evidence shows that MLS aligns more closely with Kawasaki disease than measles in age distribution, symptom profile, and epidemiological behavior. Laboratory diagnostics — particularly PCR and IgM — are insufficient to resolve this ambiguity, especially in low‑biosafety settings. Vaccine‑surveillance data demonstrate that KD appears across multiple vaccine categories, including measles‑containing vaccines, complicating interpretation during immunization campaigns. Bangladesh’s national vaccination schedule further amplifies diagnostic uncertainty by creating multiple temporal windows in which KD may appear.
Biosafety constraints and regional dynamics add another layer of complexity, highlighting the need for independent diagnostic verification and strengthened biosafety governance. Ultimately, MLS reflects a structural phenomenon rather than a single‑pathogen outbreak. Addressing it requires a holistic approach that integrates clinical evaluation, laboratory confirmation, biosafety capacity, and transparent investigation. Only by acknowledging and addressing these structural vulnerabilities can public trust be restored and future diagnostic crises avoided.
Bangladesh’s recent reports of “measles‑like symptoms” (MLS) among children have raised complex questions about diagnostic certainty, biosurveillance capacity, and the geopolitical context of high‑containment laboratory infrastructure. While official narratives attribute the outbreak to measles, the epidemiological pattern—pediatric‑only fatalities, absence of adult cases, and inconsistent laboratory confirmation—suggests a more nuanced reality. This article applies the VBHI Pseudoscience Framework to examine MLS as a diagnostic construct shaped by uncertainty, institutional limitations, and global partnerships. Bangladesh possesses multiple BSL‑3 laboratories but lacks BSL‑4 capability, relies heavily on international partners for high‑risk pathogen analysis, and operates within a regional environment where neighboring Pakistan has been accused of engaging in dual‑use research with China. These structural constraints shape how outbreaks are interpreted, investigated, and communicated.
The analysis is also examining the clinical overlap between measles and Kawasaki disease (KD), the limitations of PCR and IgM assays, and the documented presence of KD in global vaccine surveillance systems. KD appears in FDA labels, active surveillance registries, and post‑marketing safety networks across multiple countries, complicating the interpretation of MLS during immunization campaigns. The article also explores concerns surrounding gain‑of‑function (GoF) research in Bangladesh, where high‑fatality pathogens such as Nipah virus and H5N1 are studied in facilities that have historically faced biosafety and oversight challenges.
By integrating biosafety infrastructure, diagnostic uncertainty, vaccine surveillance data, and regional geopolitical dynamics, this article argues that MLS in Bangladesh cannot be understood solely as a measles outbreak. Instead, it reflects a convergence of structural vulnerabilities, clinical ambiguity, and global biosecurity pressures. Transparent investigation, strengthened biosafety governance, and independent diagnostic verification are essential to restoring public trust and ensuring accurate outbreak interpretation.
Introduction
Bangladesh occupies a unique position in the global biosurveillance landscape. As a densely populated country with endemic high‑risk pathogens such as Nipah virus and avian influenza H5N1, it faces recurring public‑health challenges that demand robust diagnostic and containment capabilities. Yet Bangladesh’s biosafety infrastructure remains uneven: while the country operates several BSL‑3 laboratories, it lacks any operational BSL‑4 facility. Extreme‑risk pathogens must be shipped abroad for analysis, creating structural dependencies that shape outbreak narratives and diagnostic certainty.
Against this backdrop, the emergence of “measles‑like symptoms” (MLS) among children has generated widespread concern. Official reports attribute the outbreak to measles, but the epidemiological pattern is atypical. Measles is a highly contagious virus that affects both children and susceptible adults; yet MLS cases in Bangladesh have been confined almost exclusively to children, with no corresponding adult infections. Laboratory confirmation has been inconsistent, relying heavily on PCR and IgM assays that detect fragments or immune responses rather than active infection. These limitations create diagnostic ambiguity that can obscure alternative explanations.
Kawasaki disease (KD), a pediatric vasculitis with overlapping clinical features, emerges as a plausible differential diagnosis. KD is documented in vaccine surveillance systems across multiple countries and appears in FDA labels for rotavirus vaccines. Active surveillance registries in Canada, Singapore, Taiwan, the United States, and the United Kingdom have identified KD clusters within 0–42 days of vaccination. The persistence of KD in regulatory and surveillance data complicates the interpretation of MLS during immunization campaigns.
This article provides the structural foundation for understanding why MLS has become a contested diagnostic category. Bangladesh’s reliance on international partners for high‑containment diagnostics, its expanding but uneven biosafety infrastructure, and its proximity to regional dual‑use research allegations create an environment where diagnostic uncertainty can be amplified. This article integrates these structural factors with clinical, epidemiological, and surveillance data to provide a comprehensive analysis of MLS in Bangladesh.
Section 1: Biosafety Infrastructure And Structural Vulnerabilities
Bangladesh’s high‑containment laboratory landscape is defined by a network of BSL‑3 facilities supported through extensive international collaboration. Institutions such as icddr,b, the Sylhet DR‑TB laboratory, and the MORU field labs operate with technical and financial support from partners including the US CDC, USAID, the University of Oxford, and The Global Fund. These partnerships have strengthened Bangladesh’s diagnostic capacity but also created dependencies that shape how outbreaks are investigated and interpreted. Without an operational BSL‑4 facility, Bangladesh cannot independently analyze the most dangerous pathogens, relying instead on foreign laboratories for confirmation. This structural limitation introduces delays, external influence, and potential blind spots in outbreak assessment.
China’s growing role in Bangladesh’s biosafety development is clear. Chinese partners provide training in Good Manufacturing Practices (GMP), high‑biosafety‑risk workshop management, and mobile BSL‑3 laboratory technology. These collaborations enhance Bangladesh’s capacity but also deepen its reliance on external expertise. Meanwhile, regional comparisons reveal stark asymmetries: Pakistan, Bangladesh’s neighbor, has been accused of engaging in dual‑use research with China, including work on high‑risk pathogens in BSL‑4‑equivalent facilities. While Bangladesh claims to maintain strict compliance with the Biological Weapons Convention (BWC), the regional environment underscores the importance of robust biosafety governance and independent diagnostic verification.
Section 2: Diagnostic Ambiguity And The MLS Construct
The term “measles‑like symptoms” is inherently ambiguous. It describes a constellation of fever, rash, and conjunctivitis that can arise from multiple conditions, including measles, rubella, roseola, scarlet fever, drug reactions, and Kawasaki disease. By treating MLS as synonymous with measles, public‑health authorities risk conflating distinct clinical entities under a single narrative. PCR and IgM assays, the primary tools used to support the measles hypothesis, have well‑documented limitations. PCR detects genetic fragments that may persist long after infection or arise from contamination, while IgM assays are prone to cross‑reactivity and timing variability. These limitations make it difficult to conclusively diagnose measles without clinical correlation and epidemiological consistency.
The epidemiological pattern of MLS in Bangladesh further complicates the measles narrative. Measles outbreaks typically affect both children and susceptible adults, yet MLS cases have been confined to children. This pediatric‑only pattern aligns more closely with Kawasaki disease, a non‑infectious vasculitis that primarily affects children under five. KD presents with fever, rash, conjunctivitis, mucous‑membrane changes, and extremity involvement—features that overlap with MLS. Misdiagnosis is plausible, especially in settings where diagnostic tools are limited and clinical expertise varies.
Section 3: Comparative Clinical Analysis
To understand the diagnostic ambiguity surrounding MLS, it is essential to compare the clinical and epidemiological features of measles and Kawasaki disease. Both conditions present with fever and rash, but their underlying mechanisms, age distributions, and complications differ significantly. The table below outlines these distinctions, providing a framework for interpreting MLS in Bangladesh.
Table 1: When Symptoms Deceive: Clinical And Epidemiological Contrasts Between Measles And Kawasaki Disease
The clinical distinctions between measles and Kawasaki disease reveal why MLS cannot be assumed to represent measles without rigorous diagnostic confirmation. Measles is characterized by a classic prodrome of cough, coryza, conjunctivitis, and Koplik spots, followed by a descending maculopapular rash. It is highly contagious and typically affects both children and susceptible adults. In contrast, Kawasaki disease presents with prolonged fever, mucous‑membrane changes, extremity involvement, and a polymorphous rash. It is non‑contagious and primarily affects children under five. The absence of adult cases in Bangladesh’s MLS outbreak is inconsistent with measles but aligns with KD’s age distribution. This epidemiological pattern suggests that KD should be considered a plausible differential diagnosis.
The complications associated with each condition further underscore the importance of accurate diagnosis. Measles can lead to pneumonia and encephalitis, while KD can cause coronary artery aneurysms and myocarditis. Misdiagnosing KD as measles could delay appropriate treatment, increasing the risk of long‑term cardiac complications. The reliance on PCR and IgM assays to support the measles hypothesis is problematic, given their limitations. PCR detects genetic fragments that may not indicate active infection, while IgM assays are prone to cross‑reactivity. Without clinical correlation and epidemiological consistency, these tests cannot conclusively diagnose measles. The MLS construct, therefore, reflects diagnostic ambiguity that must be addressed through comprehensive clinical evaluation and independent verification.
Section 4: Diagnostic Tools Under Scrutiny
Laboratory confirmation is often treated as the gold standard for diagnosing infectious diseases, but PCR and IgM assays have inherent limitations that can lead to misinterpretation. The table below outlines the intended purpose and limitations of these tests, highlighting why they cannot conclusively diagnose measles without clinical and epidemiological context.
Table 2: The Illusion Of Certainty: Limitations Of PCR And IgM In Measles Diagnosis
Test
Intended Purpose
Limitations
PCR
Detect viral genetic material
Amplifies fragments, not live virus; contamination risk; false positives
PCR’s sensitivity is both its strength and its weakness. While it can detect minute quantities of viral genetic material, it cannot distinguish between live virus and residual fragments. This limitation is particularly relevant in the context of MLS, where PCR positives may reflect contamination, past infection, or non‑specific amplification. The risk of false positives is heightened in high‑throughput settings where multiple samples are processed simultaneously. Without clinical correlation, PCR results can create a false sense of certainty that obscures alternative diagnoses such as Kawasaki disease.
IgM assays add another layer of complexity. IgM antibodies can cross‑react with unrelated pathogens, leading to false positives. The timing of IgM production varies among individuals, making it difficult to interpret results without considering the clinical timeline. When PCR and IgM are used together, they provide suggestive evidence but cannot conclusively diagnose active measles infection. The reliance on these tests to support the measles hypothesis in Bangladesh reflects a broader issue: the tendency to equate detection with proof. This conflation can lead to diagnostic errors, misclassification, and inappropriate public‑health responses.
Section 5: Vaccine Surveillance And The KD Connection
Kawasaki disease appears in vaccine surveillance systems across multiple countries, complicating the interpretation of MLS during immunization campaigns. The table below summarizes KD associations with various vaccines, drawing on regulatory documents and active surveillance registries.
Table 3: Signals In The System: Kawasaki Disease In Global Vaccine Surveillance Networks
Vaccine Category
Specific Vaccines
Nature of Association
Rotavirus
RotaTeq, Rotarix, LLR
KD listed in FDA labels due to trial imbalances
Pneumococcal
PCV13, Pneumo 23
Case reports in surveillance systems
Hepatitis
Hepatitis A/B
Individual case reports
Combination
DTaP‑IPV‑HepB‑Hib
KD reports in VAERS
Others
Influenza, MMR, BCG
Temporal KD occurrences
Analysis
The presence of Kawasaki disease in vaccine surveillance systems is well‑documented. FDA labels for rotavirus vaccines list KD due to imbalances observed in clinical trials, while passive surveillance systems such as VAERS contain KD reports across multiple vaccine categories. These signals highlight the need for careful interpretation of MLS during immunization campaigns. KD’s appearance in regulatory documents and surveillance networks underscores its relevance as a differential diagnosis, particularly in settings where diagnostic tools are limited and clinical expertise varies.
Active surveillance registries provide further evidence of KD clustering within 0–42 days of vaccination. Programs in Canada, Singapore, Taiwan, the United States, and the United Kingdom have identified KD cases temporally associated with vaccines such as DTaP, PCV, and rotavirus. These findings are not speculative; they are documented in peer‑reviewed studies and regulatory reports. The overlap between KD incidence and routine immunization schedules complicates the interpretation of MLS in Bangladesh, where cases have been reported primarily among young children. Misdiagnosis is plausible, especially during mass vaccination campaigns.
Section 6: The MMR Paradox And Immune Modulation
The measles vaccine occupies a central position in the MLS narrative, yet surveillance data reveal a paradox: KD clusters occur within days of MMR vaccination. The table below summarizes key findings from global surveillance systems.
Table 4: The Measles Paradox: Kawasaki Disease Patterns In MMR Surveillance Data
Surveillance Aspect
Findings
Temporal Onset
Median KD onset 8 days post‑MMR
Observed Risk
KD clusters suggest a direct association
Comparison
Fewer KD reports than DTaP or PCV
Diagnostic Certainty
81% complete KD, 14% incomplete KD
Analysis
The MMR–KD paradox highlights the complexity of interpreting surveillance data. KD clusters have been documented within days of MMR vaccination, suggesting a temporal association. The presence of KD clusters in surveillance systems cannot be ignored.
In the context of MLS in Bangladesh, the MMR paradox underscores the need for nuanced interpretation. If MLS cases coincide with measles vaccination campaigns, they represent misdiagnosed KD. The pediatric‑only pattern of MLS aligns with KD’s age distribution, while the absence of adult cases is inconsistent with measles. The reliance on PCR and IgM assays to support the measles hypothesis is problematic, given their limitations. A comprehensive approach that considers clinical, epidemiological, and surveillance data is essential to accurately interpret MLS.
Section 7: Biosafety, Gain‑Of‑Function, And Regional Dynamics
Bangladesh’s biosafety landscape is shaped by its status as a hotspot for high‑fatality pathogens such as Nipah virus and avian influenza H5N1. Research on these pathogens involves studying viral evolution, transmissibility, and antigenic drift—activities that can intersect with gain‑of‑function (GoF) concerns. Biosafety and oversight gaps are there in Bangladesh, including the use of BSL‑1/2 facilities for high‑risk testing and the ambiguous “BSL‑2+” designation. These gaps raise questions about containment, transparency, and regulatory oversight.
Regional dynamics further complicate the picture. Pakistan has faced allegations of engaging in dual‑use research with China, including work on high‑risk pathogens in BSL‑4‑equivalent facilities. While Bangladesh claims to maintain strict compliance with the Biological Weapons Convention (BWC), the regional environment underscores the importance of robust biosafety governance. The combination of high‑risk pathogens, containment mismatches, and shifting funding sources creates structural vulnerabilities that can influence outbreak interpretation. MLS must be understood within this broader context of biosafety capacity, geopolitical dynamics, and global biosecurity pressures.
Conclusion
The emergence of “measles‑like symptoms” in Bangladesh cannot be understood solely through the lens of infectious disease. This article reveals a biosafety landscape defined by structural vulnerabilities, international dependencies, and regional geopolitical dynamics. Bangladesh’s lack of BSL‑4 capability, reliance on foreign partners for high‑risk pathogen analysis, and uneven biosafety infrastructure create an environment where diagnostic ambiguity can be amplified. Supporting materials demonstrate that MLS overlaps clinically with Kawasaki disease, a pediatric vasculitis documented in global vaccine surveillance systems. The limitations of PCR and IgM assays further complicate the measles hypothesis, while the pediatric‑only pattern of MLS aligns more closely with KD.
The MMR paradox, vaccine surveillance data, and active registry findings underscore the need for nuanced interpretation of MLS during immunization campaigns. Misdiagnosis is plausible, especially in settings where diagnostic tools are limited and clinical expertise varies. Concerns surrounding gain‑of‑function research, biosafety gaps, and regional dual‑use research allegations highlight the importance of robust biosafety governance and independent diagnostic verification.
Ultimately, MLS in Bangladesh reflects a convergence of structural vulnerabilities, clinical ambiguity, and global biosecurity pressures. A comprehensive approach that integrates biosafety infrastructure, clinical evaluation, laboratory confirmation, and independent oversight is essential to accurately interpret MLS and restore public trust. Transparent investigation, strengthened biosafety.
This article integrates comparative clinical analysis, diagnostic reliability critiques, and vaccine surveillance data. Regulatory documents explicitly list KD in vaccine labels (e.g., RotaTeq, Rotarix), and active surveillance registries confirm clusters of KD cases temporally associated with vaccines such as DTaP, PCV, and rotavirus. While large datasets argue against causation, the persistence of KD reports in regulatory and registry systems cannot be dismissed.
The VBHI framework contends that MLS represents either misdiagnosed KD triggered by prior vaccination or deliberate biological interference. By weaponizing diagnostic ambiguity and fear, authorities sustain compliance while obscuring deeper realities. Transparent investigation is imperative to determine whether Bangladesh’s MLS crisis is a public‑health failure or a covert biological experiment.
Introduction
The official narrative frames MLS as measles. Yet measles is a highly contagious virus that should affect both children and susceptible adults. The confinement of MLS to pediatric cases undermines this claim. MLS itself is not a diagnosis but a descriptive label encompassing febrile rash illnesses, including rubella, roseola, scarlet fever, and Kawasaki disease. By presuming measles without definitive laboratory confirmation, authorities risk conflating diverse conditions under a fear‑laden banner.
The VBHI Pseudoscience Framework identifies this as medical gaslighting: uncertainty manipulated to sustain compliance. PCR and IgM assays, the cornerstones of the measles narrative, are inherently limited. PCR amplifies fragments without proving active infection, while IgM cross‑reacts with unrelated pathogens. Together, they provide suggestive but not conclusive evidence.
Meanwhile, Kawasaki disease has been repeatedly flagged in vaccine surveillance systems. FDA labels for rotavirus vaccines explicitly mention KD, and registries across Canada, Singapore, Taiwan, and the USA confirm clusters of KD cases within 42 days of vaccination. These findings, quoted directly from regulatory and registry data, demand serious consideration in the MLS context.
Comparative Clinical Analysis: When Measles Isn’t Measles
The epidemiological inconsistency is striking. Measles should not spare adults, yet MLS has been confined to children. This demographic pattern aligns more closely with Kawasaki disease, a pediatric vasculitis, than with measles.
Clinically, the distinction is clear: Koplik spots and respiratory prodrome define measles, while mucous‑membrane changes and extremity involvement define Kawasaki. The conflation of these syndromes under MLS reflects diagnostic negligence. If a bio‑warfare agent were engineered to trigger Kawasaki‑like inflammation, its presentation would blur these boundaries, producing confusion and fear.
Diagnostic Reliability And The Bio‑Warfare Hypothesis: Science As Theater
Test
Intended Purpose
Limitations
PCR
Detect viral genetic material
Amplifies fragments, not live virus; contamination risk; false positives
PCR’s extreme sensitivity makes it vulnerable to contamination and misinterpretation. In a bio‑warfare scenario, a synthetic agent could be designed to produce non‑specific genetic fragments that trigger false PCR positives, sustaining the illusion of a viral epidemic.
IgM’s cross‑reactivity could be exploited to produce misleading serological patterns. A bio‑agent engineered to provoke immune confusion would yield erratic IgM results, reinforcing the narrative of “mysterious measles‑like illness.” Together, these limitations transform diagnostics into a pseudoscientific theater masking deeper bio‑political motives.
Vaccine Associations With Kawasaki Disease: The Shadow Of Immunization
Vaccine Category
Specific Vaccines Mentioned
Nature of Association
Rotavirus
RotaTeq, Rotarix, Lanzhou lamb (LLR)
FDA labels list KD after trial imbalances
Pneumococcal
PCV13 (Prevnar 13), Pneumo 23
Case reports documented in surveillance
Hepatitis
Hepatitis B, Hepatitis A
Individual case reports post‑vaccination
Combination
DTaP‑IPV‑HepB‑Hib, Pediarix, Pentacel
KD reports in VAERS surveillance
Others
Influenza, MMR, BCG, Yellow Fever, SARS‑CoV‑2
Temporal KD occurrences in case‑control studies
Analysis
Regulatory documents explicitly list KD in rotavirus vaccine labels due to imbalances in trial data (e.g., 5 cases in RotaTeq vs. 1 in placebo). Passive surveillance systems like VAERS confirm KD reports across multiple vaccines.
While manufacturers deny causation, the persistence of KD in regulatory documents sustains suspicion. In the MLS context, these associations cannot be dismissed as “rare” but must be acknowledged as documented adverse events.
Active Surveillance And Registry Data: Watching The Watchers
Surveillance Program / Registry
Vaccines Implicated
Key Findings
IMPACT (Canada)
DTaP, PCV, Influenza
58 confirmed KD cases within 42 days of vaccination
KKH/HSA (Singapore)
5‑in‑1, Influenza, PCV, Varicella
KD identified as common AEFI
Taiwan NHID
Rotavirus
2,079 KD cases; delayed risk post‑dose
VSD (USA)
PCV13, Rotavirus
97 chart‑confirmed KD cases
Sentinel/PRISM (USA)
PCV13
43 KD cases in risk interval
UKHSA (UK)
PCV, MenB
553 validated KD admissions
Analysis
Active surveillance registries confirm KD clusters temporally associated with vaccines, often within 0–42 days. These findings are quoted directly from registry data and cannot be dismissed.
Incomplete KD cases complicate diagnosis, but the clustering sustains suspicion. In the MLS context, such overlaps could be misinterpreted as vaccine‑induced vasculitis or exploited to mask bio‑agent exposure.
Infant Immunization Schedule And KD: The Vulnerable Window
Before presenting the table, it is important to emphasize that Kawasaki Disease (KD) reports are not evenly distributed across all ages. Surveillance data consistently highlight a vulnerable window in infancy and early childhood, coinciding with the most intensive vaccine administration schedules. This overlap has been documented in multiple registries and regulatory reviews, making it a critical lens through which to interpret the MLS crisis in Bangladesh.
Vaccine Category
Specific Vaccines
Common Age Group(s)
Typical Schedule (Doses)
Rotavirus
RotaTeq (RV5), Rotarix (RV1)
6 weeks – 8 months
2, 4, and 6 months
Pneumococcal (PCV)
Prevnar 13/20 (PCV13/20)
2 months – 5 years
2, 4, 6, and 12–15 months
Combination (DTP)
Pediarix, Pentacel, Infanrix
2 months – 6 years
2, 4, 6, 15–18 months; 4–6 years
Meningococcal B
Bexsero, Trumenba
2 months – 23 months
2, 4, and 12–15 months
Hepatitis B
Engerix‑B, Recombivax HB
Birth – 18 months
Birth, 1–2 months, and 6–18 months
Influenza
Fluarix, Fluzone
6 months – Adulthood
Annual (starting at 6 months)
MMR / Varicella
M‑M‑R II, Varivax, ProQuad
12 months – 6 years
12–15 months and 4–6 years
Hepatitis A
Havrix, Vaqta
12–23 months
Two doses, 6 months apart
Analysis
Registry data show that KD cases frequently cluster in infants between 2 and 6 months of age — precisely the period of the primary vaccine series. The Canadian IMPACT registry reported that 55% of KD cases occurred within 14 days of vaccination, while Taiwan’s NHID identified over 2,000 KD cases with delayed onset following rotavirus doses. These findings demonstrate that the vulnerable window is not theoretical but empirically observed. The overlap between vaccine schedules and KD incidence raises the possibility that immune sensitization during early infancy may predispose children to vasculitic reactions, whether triggered by vaccines themselves or exploited by a bio‑agent designed to mimic such responses.
The clustering of KD cases during booster phases (12–18 months) further complicates the narrative. MLS in Bangladesh has been reported primarily in young children, aligning with these immunization windows. If KD is being misdiagnosed as measles, the timing of vaccine administration becomes a crucial variable. Alternatively, if a bio‑warfare agent is involved, targeting children during peak immunization periods would maximize confusion, as natural KD incidence and vaccine‑associated reports overlap. This convergence sustains the VBHI framework’s contention that MLS gaslighting reflects either vaccine‑linked vasculitis or deliberate biological interference.
MMR Vaccine And KD: The Measles Paradox
The measles vaccine is central to the MLS narrative, yet surveillance data complicate its role. KD has been temporally associated with MMR vaccination, though large datasets often show reduced incidence post‑vaccination. This paradox underscores the difficulty of disentangling background KD rates from vaccine triggers.
Surveillance Aspect
Findings for MMR/MMRV Vaccines
Temporal Onset
Median KD onset 8 days post‑MMR (IQR: 4–20 days)
Observed Risk
VSD study (1.7 million children) found KD rates lower in 42 days post‑MMR (rate ratio 0.50)
Comparison to Other Vaccines
MMR accounts for fewer KD reports than DTaP (53%) or PCV (36%)
The temporal onset of KD symptoms within 8 days of MMR vaccination is repeatedly documented in surveillance systems. While large datasets argue against causation, the clustering cannot be ignored. In Bangladesh, MLS cases coinciding with measles vaccination campaigns could represent misdiagnosed KD, especially given the pediatric‑only fatalities.
The paradox of reduced KD incidence post‑MMR in large datasets may reflect immune modulation rather than absence of risk. If vaccines transiently disrupt KD‑triggering pathways, outbreaks like MLS could represent children whose immune systems were sensitized differently — either by prior vaccination or by exposure to a synthetic agent exploiting these pathways. This duality sustains the VBHI framework’s claim that MLS gaslighting masks deeper biological manipulation.
Active Surveillance Systems: Global Eyes on KD
Surveillance systems across the US, UK, EU, and Asia actively monitor KD following vaccination. Their findings provide critical context for interpreting MLS.
Vaccine Category
Specific Vaccines & Surveillance Focus
Surveillance System / Network
Observation Status (2025–2026)
Pneumococcal
PCV13, PCV15, PCV20
VSD (US), Sentinel/PRISM (US), UKHSA (UK)
Continued monitoring; KD cases observed
Rotavirus
RotaTeq, Rotarix
VSD (US), IMPACT (Canada), EU/ECDC
KD monitored in infants under 2 years
DTP‑Combination
6‑in‑1 (UK/EU), DTaP (US)
NHS/UKHSA (UK), IMPACT (Canada)
KD frequently detected within 42 days
Meningococcal B
Bexsero
NHS/UKHSA (UK)
KD monitored at 8 and 12 weeks
Influenza
LAIV, Inactivated
NHS (UK), CDC (US)
KD monitored annually in pediatric flu campaigns
Varicella / MMR
MMRV, Varivax
VSD (US), EU Registries
KD monitored during 12–15 month and 4–6 year boosters
Analysis
Surveillance systems confirm KD cases temporally associated with multiple vaccines. The UKHSA validated over 500 KD admissions linked to PCV and MenB schedules, while US Sentinel/PRISM identified dozens of KD cases post‑PCV13. These findings are not speculative but documented, reinforcing the need to scrutinize MLS in Bangladesh through the lens of vaccine‑associated KD.
The persistence of KD monitoring across global surveillance systems underscores its recognition as an adverse event of special interest. In Bangladesh, MLS coinciding with immunization campaigns could represent KD cases misclassified as measles. Alternatively, if a bio‑agent is involved, exploiting these surveillance blind spots would allow covert manipulation to masquerade as routine vaccine‑linked KD clusters.
Conclusion
The MLS crisis in Bangladesh cannot be explained solely as measles. The VBHI Pseudoscience Framework reveals diagnostic ambiguity, selective reporting, and fear amplification that undermine the measles narrative. Kawasaki disease offers a plausible medical explanation, supported by regulatory documents and surveillance registries that explicitly list KD as temporally associated with multiple vaccines.
At the same time, the possibility of a bio‑warfare agent engineered to mimic viral illness and exploit diagnostic limitations introduces a far more alarming dimension. The clustering of KD cases during immunization windows, the pediatric‑only fatalities, and the reliance on unreliable laboratory tools all point toward deliberate manipulation.
Ultimately, MLS gaslighting reflects not only diagnostic negligence but also potential bio‑political experimentation. Transparent investigation, independent verification, and international oversight are imperative. Until such scrutiny occurs, Bangladesh’s MLS outbreak remains not merely a medical mystery but a manifestation of pseudoscience and possible bio‑warfare disguised as public health.
The phenomenon of “measles‑like symptoms” (MLS) reported across Bangladesh has raised profound questions about the nature of the outbreak and the integrity of its interpretation. The VBHI Pseudoscience Framework contends that MLS has been used as a fear‑based narrative to justify vaccine mandates and suppress alternative diagnoses such as Kawasaki disease. Yet the epidemiological anomalies — child‑only fatalities, absence of adult cases, and inconclusive laboratory results — suggest a deeper, more disturbing possibility: the involvement of a bio‑warfare agent. This article explores the hypothesis that MLS may represent either a misdiagnosed non‑infectious pediatric vasculitis or exposure to a synthetic pathogen engineered to mimic viral illness while evading standard detection. Through comparative clinical analysis, critique of PCR and IgM reliability, and examination of the sociopolitical context, the study argues that MLS gaslighting may reflect not only medical negligence but also potential bio‑political manipulation. The conclusion calls for transparent investigation into whether Bangladesh’s MLS crisis is a public‑health failure or a covert biological experiment.
Introduction
The official narrative surrounding the MLS outbreak in Bangladesh describes a wave of pediatric deaths attributed to measles. However, the evidence underpinning this claim is tenuous. MLS is not a diagnosis but a descriptive label encompassing a spectrum of febrile rash illnesses. By presuming measles without definitive laboratory confirmation, authorities risk conflating Kawasaki disease, rubella, roseola, scarlet fever, and other conditions under a single, fear‑laden banner.
The VBHI Pseudoscience Framework identifies this as a classic case of medical gaslighting — the manipulation of uncertainty to sustain fear and compliance. PCR and IgM assays, the cornerstone of the measles narrative, are inherently limited: PCR amplifies genetic fragments without distinguishing live virus from debris, while IgM cross‑reacts with unrelated pathogens and fluctuates in timing. Together, they provide suggestive but not conclusive evidence.
The epidemiological pattern deepens the mystery. Measles, a highly contagious virus, should affect both children and susceptible adults. Yet the MLS outbreak has reportedly claimed only young lives, leaving adults untouched. Such age‑specific mortality is inconsistent with measles but eerily compatible with Kawasaki disease or exposure to a targeted biological agent. The possibility of a bio‑warfare agent — a synthetic pathogen or toxin designed to mimic viral illness and evade standard diagnostics — must therefore be considered.
Comparative Analysis
Clinical And Epidemiological Contrasts Between Measles And Kawasaki Disease
The table underscores the epidemiological inconsistency of the MLS narrative. Measles should not spare adults, yet the outbreak’s confinement to children suggests a non‑infectious or engineered cause. Kawasaki disease, a pediatric vasculitis, fits the demographic pattern but not the contagion narrative. The VBHI framework posits that MLS may represent either misdiagnosed Kawasaki disease or exposure to a bio‑agent designed to mimic it.
Clinically, the distinction between measles and Kawasaki is clear: Koplik spots and respiratory prodrome define measles, while mucous‑membrane changes and extremity involvement define Kawasaki. The conflation of these syndromes under MLS reflects diagnostic negligence. If a bio‑warfare agent were engineered to trigger Kawasaki‑like inflammation, its presentation would blur these boundaries, producing confusion and fear — precisely the conditions under which pseudoscience thrives.
Table Heading: *Diagnostic Reliability And The Bio‑Warfare Hypothesis
Test
Intended Purpose
Limitations
PCR
Detect viral genetic material
Amplifies fragments, not live virus; contamination risk; false positives
PCR’s extreme sensitivity makes it vulnerable to contamination and misinterpretation. In a bio‑warfare scenario, a synthetic agent could be designed to produce non‑specific genetic fragments that trigger false PCR positives, sustaining the illusion of a viral epidemic. The VBHI framework warns that such manipulation transforms diagnostic science into a tool of psychological control.
IgM testing adds another layer of uncertainty. Cross‑reactivity with unrelated antigens could be exploited to produce misleading serological patterns. A bio‑agent engineered to provoke immune confusion would yield erratic IgM results, reinforcing the narrative of “mysterious measles‑like illness.” The combination of unreliable tests and fear‑based messaging thus becomes a mechanism of gaslighting — a pseudoscientific theater masking deeper bio‑political motives.
Conclusion
The MLS crisis in Bangladesh cannot be understood solely through the lens of infectious disease. The VBHI Pseudoscience Framework reveals a pattern of diagnostic ambiguity, selective reporting, and fear amplification that points toward deliberate manipulation. The absence of adult cases, the pediatric‑only fatalities, and the reliance on unreliable laboratory tools undermine the measles narrative. Kawasaki disease offers a plausible medical explanation, but the possibility of a bio‑warfare agent — a synthetic pathogen or toxin targeting children — introduces a far more alarming dimension.
If MLS represents a covert biological experiment, its implications extend beyond medicine into ethics, governance, and global security. The conflation of detection with proof, and of uncertainty with authority, erodes public trust and weaponizes science against the very populations it claims to protect. Transparent investigation, independent verification, and international oversight are imperative. Until such scrutiny occurs, MLS remains not merely a medical mystery but a potential manifestation of bio‑warfare disguised as public health.
The VBHI Pseudoscience Framework critically interrogates the deployment of “measles‑like symptoms” (MLS) in Bangladesh as a diagnostic and political construct. This article argues that MLS has been weaponized as a gaslighting strategy to sustain fear narratives, justify vaccine mandates, and obscure alternative explanations such as Kawasaki disease. Beyond diagnostic ambiguity, the framework raises the possibility that a bio‑warfare agent may be implicated, given the unusual epidemiological pattern of child‑only fatalities, absence of adult cases, and reliance on unreliable laboratory tools. PCR and IgM assays, central to the measles narrative, amplify fragments or immune reactions without conclusively proving viral presence. When interpreted without clinical or epidemiological corroboration, these tests risk overstating certainty and enabling fear‑driven responses. By comparing measles and Kawasaki disease, analyzing the weaknesses of PCR and IgM, and introducing the hypothesis of bio‑warfare involvement, this article demonstrates that MLS gaslighting represents a dangerous blend of pseudoscience, medical negligence, and potential bio‑political manipulation. Tables are presented to contrast clinical features and diagnostic reliability, followed by extended analysis. The conclusion asserts that MLS gaslighting, possibly linked to bio‑warfare experimentation, undermines public trust and demands transparent investigation.
Introduction
Reports of “measles‑like symptoms” in Bangladesh have been framed as a national outbreak, yet the evidence remains ambiguous and contested. MLS is not a diagnosis but a descriptive label encompassing diverse febrile rash illnesses. By presuming measles without laboratory confirmation, public health authorities risk conflating Kawasaki disease, rubella, roseola, scarlet fever, drug eruptions, and other conditions under a single fear‑laden narrative.
The VBHI Pseudoscience Framework identifies MLS as a form of medical gaslighting, where uncertainty is weaponized to sustain fear and enforce vaccine mandates. The framework critiques the reliance on PCR and IgM assays, both of which suffer from inherent limitations. PCR amplifies genetic fragments without distinguishing live virus from debris, while IgM cross‑reacts with other pathogens and varies in timing. Together, they provide suggestive but not conclusive evidence.
More troubling is the epidemiological anomaly: child‑only fatalities with no adult cases. Measles, being highly contagious, would ordinarily affect susceptible adults as well. Kawasaki disease, a non‑infectious pediatric vasculitis, aligns more closely with this pattern. Yet the possibility of a bio‑warfare agent cannot be dismissed. A deliberately engineered pathogen or toxin targeting pediatric physiology could mimic MLS, producing fear while evading detection through conventional tests. This hypothesis underscores the need for transparent investigation and independent verification.
Use Of Bio Warfare Agent And Measles Like Symptoms (MLS) Gaslighting In Bangladesh
Illnesses Behind The Mask Of MLS: Comparative Clinical And Epidemiological Features
To understand the pseudoscientific deployment of MLS, it is essential to compare measles and Kawasaki disease side by side. Both illnesses can present with fever, rash, and conjunctivitis, but their epidemiological patterns and clinical markers diverge sharply. The following table outlines key differentiators.
The table demonstrates that measles is a communicable disease with a broad age distribution, while Kawasaki is a non‑infectious pediatric vasculitis. The absence of adult cases in Bangladesh undermines the measles narrative, since outbreaks typically affect both children and susceptible adults. Kawasaki’s age restriction and non‑contagious nature align more closely with the observed pattern of child‑only fatalities.
Clinical markers further distinguish the two. Koplik spots and the “3 C’s” (cough, coryza, conjunctivitis) are hallmarks of measles, whereas Kawasaki is defined by mucous‑membrane changes, extremity involvement, and coronary complications. Mislabeling Kawasaki as MLS erases these distinctions, leading to inappropriate public health responses. The VBHI framework warns that such conflation is pseudoscientific gaslighting, designed to sustain fear rather than clarify diagnosis. The anomaly of child‑only deaths also raises suspicion of an external agent, potentially bio‑warfare in nature, engineered to mimic pediatric vasculitis while being misclassified as measles.
Diagnostic Tools Under Scrutiny: PCR and IgM Reliability
Beyond clinical features, laboratory tools are central to the MLS narrative. PCR and IgM assays are treated as conclusive proof of measles, yet both suffer from fundamental limitations. The following table outlines their weaknesses.
Test
Intended Purpose
Limitations
PCR
Amplify viral genetic material
Detects fragments, not live virus; contamination risk; false positives
Still cannot prove active, transmissible infection
Analysis
PCR’s sensitivity is its Achilles heel. It can amplify residual fragments long after infection has resolved, or even in the absence of active disease. Contamination and mis‑priming further compromise specificity. In the context of MLS, PCR positives may reflect debris rather than active measles virus, yet they are treated as definitive proof. This over‑interpretation sustains fear narratives and obscures alternative explanations.
IgM testing compounds the uncertainty. Cross‑reactivity with other pathogens and variability in antibody timing make it unreliable as a stand‑alone marker. When combined with PCR, the tests provide suggestive evidence but still fall short of proving active infection. The VBHI framework argues that treating these results as conclusive is pseudoscientific, enabling fear narratives and vaccine mandates without robust evidence. Moreover, if a bio‑warfare agent were engineered to evade or confuse these assays, reliance on PCR and IgM would only deepen misdiagnosis, reinforcing the MLS gaslighting strategy.
Conclusion
The VBHI Pseudoscience Framework exposes MLS as a gaslighting strategy in Bangladesh, where ambiguous symptom labels and unreliable tests are deployed to sustain fear and enforce vaccine mandates. The absence of adult cases, the pediatric‑only fatality pattern, and the diagnostic weaknesses of PCR and IgM undermine the measles narrative. Kawasaki disease provides a more coherent explanation, yet it is ignored in favor of MLS.
The possibility of a bio‑warfare agent adds a chilling dimension. A deliberately engineered pathogen or toxin targeting children could mimic Kawasaki disease or measles‑like illness, evade standard diagnostics, and be misclassified under MLS. Such a scenario would explain the epidemiological anomalies and the reliance on fear‑driven narratives.
By conflating detection with proof, public health systems risk eroding trust and perpetuating pseudoscience. MLS gaslighting represents not just medical negligence but a potential bio‑political maneuver that weaponizes uncertainty. A truly scientific approach requires transparent reporting, rigorous diagnostic confirmation, and independent investigation into the possibility of bio‑warfare involvement. Until then, MLS remains a pseudoscientific construct, serving fear rather than truth.
The VBHI Pseudoscience Framework provides a comprehensive forensic lens through which vaccine safety claims can be critically examined. It highlights the discrepancies between passive surveillance systems and active national registries, showing how institutional narratives are curated to minimize risk while registry data reveals systemic harm. This framework situates vaccine safety within a techno‑legal paradigm, demonstrating that transparency, reproducibility, and binding evidence must replace consensus rhetoric. By exposing the gap between official claims and verified medical records, the framework calls for a reassessment of the MMR vaccine’s risk‑benefit profile and challenges the legitimacy of policies built on incomplete or distorted data.
Passive vs. Active Surveillance
Passive surveillance systems such as VAERS in the United States and the Yellow Card scheme in the United Kingdom rely on voluntary reporting by physicians or patients. Studies consistently show that fewer than one percent of severe adverse events and deaths are captured, meaning the data is anecdotal and incomplete. This underreporting bias allows institutions to claim that injuries are “one in a million,” when in reality the system is designed not to see the other 99 cases. The curated subset of reality produced by passive surveillance supports a pre‑determined narrative rather than reflecting the actual clinical burden, creating a misleading impression of rarity and safety.
Active registries, by contrast, function as mandatory, automatic clinical logs. Every hospitalization and death is coded into national databases for legal and administrative purposes, ensuring complete coverage of post‑vaccination outcomes. When vaccination dates are cross‑referenced with these verified records, the illusion of rarity collapses. Registry data therefore represents the “ground truth,” immune to underreporting bias and far more reliable than curated passive systems. This divergence between passive and active models exposes the fragility of institutional claims and highlights the need for forensic audits that prioritize verified evidence over curated narratives.
Falsified Safety Claims
Institutional narratives emphasize absolute safety and portray measles as a catastrophic threat. Yet registry audits reveal clusters of neurological injuries and deaths temporally linked to MMR vaccination, alongside negligible measles mortality despite thousands of reported cases. Transmission patterns also extend beyond schools, undermining the rationale for school‑centric mandates. These findings challenge the proportionality of mandates and reveal that the burden of disease is far less severe than portrayed in consensus narratives.
By juxtaposing curated safety claims with registry‑verified harms, the framework exposes how official narratives are sustained by omission rather than transparency. The evidence demonstrates that the portrayal of measles as a crisis and vaccines as risk‑free is a distortion of reality, designed to enforce compliance rather than reflect epidemiological truth. This distortion constitutes a form of public gaslighting, where fear is amplified and risks are minimized to sustain policy mandates. In this context, the VBHI framework positions registry data as the superior evidentiary standard, capable of dismantling consensus‑based distortions.
Techno‑Legal Analysis
Statistical audits identify mortality spikes and adverse event clusters that are mathematically inconsistent with chance. Passive systems dismiss these signals as coincidence, yet fail to provide raw data to substantiate such defenses. In contrast, registry‑based audits apply rigorous statistical laws to transparent public records, transforming isolated reports into systemic forensic proof. This integration of medical science with modern data technology creates a cohesive counter‑narrative that is both scientific and legally binding, elevating registry data from anecdotal evidence to forensic fact.
From a legal perspective, registry data carries binding weight under rules of evidence. Sovereign immunity may shield institutions from liability, but unrefuted registry evidence stands as fact in both courtrooms and audits. This creates a jurisprudential reality where transparency outweighs consensus, and registry data becomes the superior evidentiary standard. The intersection of technology and law compels accountability, demanding that vaccine safety be reassessed on the basis of verified outcomes rather than curated narratives. In this context, the counter‑view is not merely opinion but a legally defensible conclusion grounded in transparency and reproducibility.
Conclusion
The VBHI Pseudoscience Framework demonstrates that vaccine safety claims are distorted by passive surveillance and consensus rhetoric. Active registries, by contrast, provide binding forensic evidence of systemic harm. The divergence between these models exposes institutional gaslighting and necessitates a reassessment of the MMR vaccine’s risk‑benefit profile. Transparency, reproducibility, and legal accountability must replace curated narratives to restore scientific integrity and public trust.
By combining clinical records with legal requirements for transparency, the framework establishes a superior evidentiary standard that demands accountability. The conclusion is clear: mandates built on incomplete data are disproportionate, erode trust, and undermine both science and law. A total reassessment of the MMR vaccine’s safety profile is not only advisable but essential to uphold integrity in public health policy and to ensure that future decisions are based on verified, binding evidence rather than curated consensus.
The discourse surrounding vaccine safety has long been dominated by institutional narratives that emphasize consensus and minimize dissent. Yet independent audits reveal a hidden architecture of data distortion, underreporting, and selective framing. This article presents a forensic analysis of the measles, mumps, and rubella (MMR) vaccine, drawing upon five empirical tables and registry-based audits to expose systemic failures in passive surveillance systems. Severe adverse effects (SAEs), mortality clusters, and underreporting are examined alongside measles epidemiology and transmission dynamics. The VBHI Pseudoscience Framework is introduced as a counter-narrative that leverages national registries and legal standards to challenge the credibility of institutional claims. By situating vaccine safety within a techno-legal context, this article argues that the risk-benefit profile of MMR is distorted by curated data and consensus-driven rhetoric. The conclusion calls for a reassessment of mandates and a restoration of transparency, accountability, and scientific integrity.
Introduction
Vaccination policy has historically been framed as a triumph of modern medicine, with measles mortality invoked as justification for mass immunization. Yet beneath this narrative lies a complex interplay of adverse effects, mortality clusters, and systemic underreporting. Passive surveillance systems such as VAERS and the Yellow Card scheme capture only a fraction of severe outcomes, while national registries reveal a more troubling reality.
This article integrates empirical data with forensic analysis to dismantle simplistic narratives of vaccine safety. Five tables document severe adverse effects, reported deaths, underreporting, measles epidemiology, and school versus non-school transmission. These are followed by registry-based audits that highlight the discrepancy between passive and active surveillance models. Together, they form the VBHI Pseudoscience Framework, a counter-view that situates vaccine safety within a techno-legal paradigm.
Clinical Burden Beyond Consensus: Empirical Tables Of MMR Safety
Before presenting the tables, it is essential to recognize that vaccine safety cannot be reduced to isolated data points. Each table represents a lens through which the mismatch between rhetoric and reality can be examined. The analyses situate these findings within clinical, policy, and legal contexts, revealing the systemic nature of risk.
Table 1: Severe Adverse Effects (SAEs) From MMR Vaccine
The spectrum of SAEs associated with MMR is multi-systemic, spanning neurological, immunological, hematological, respiratory, dermatological, digestive, musculoskeletal, sensory, and urogenital domains. Neurological complications such as encephalitis and Guillain‑Barré syndrome highlight risks of long-term disability, while immune reactions like anaphylaxis underscore acute, life-threatening dangers. Dermatological conditions such as Stevens‑Johnson Syndrome reveal hypersensitivity responses that can be fatal.
Policy implications are profound. Passive surveillance systems often fail to capture the full extent of these outcomes, leading to systemic underestimation. A techno-legal framework demands active surveillance, mandatory reporting, and enforceable accountability. Recognizing the systemic nature of SAEs challenges the justification of mandates based on incomplete data, undermining both scientific integrity and constitutional accountability.
Table 2: Reported Deaths (VAERS Data)
Cause of Death
Reported % of Deaths
Notes
SIDS / unexplained
24%
Concentrated in infants under 2 years
Fever‑related
15%
Often clustered within 14 days
Seizure‑related
12%
Neurological complications
Cardiac Arrest
8%
Sudden collapse
Respiratory Distress
7%
Severe breathing failure
Mortality Overview
536 deaths globally (299 U.S.)
52% within 14 days, 40% within first week
Analysis
Mortality data reveal clustering patterns that demand scrutiny. Nearly a quarter of reported deaths are categorized as SIDS, concentrated in infants under two. Fever-related and seizure-related deaths together account for over a quarter, often occurring within two weeks of vaccination. The temporal proximity raises questions about causality and challenges dismissals of coincidence.
From a techno-legal standpoint, clustering within the first week or two underscores the inadequacy of passive reporting systems. Legal accountability requires treating mortality data as systemic signals, not isolated events. Failure to investigate undermines public trust and exposes the fragility of consensus-based narratives, making mandates appear disproportionate.
Table 3: Underreporting Of SAEs And Deaths
Study/Framework
Key Finding
Reporting Rate
Implication
Oxford 2025
<1% of SAEs and deaths reported
<1%
Passive surveillance fails to capture outcomes
HVBI 2026
Benchmark pharmacovigilance framework
<1%
Calls for mandatory active surveillance
U.S. Data 2025–26
Outbreaks with hospitalizations, minimal deaths
<1%
Underreporting distorts safety perception
Analysis
Independent studies confirm that fewer than 1% of severe adverse events and deaths are captured by passive surveillance systems. This underreporting is systemic, not incidental, creating an illusion of rarity where systemic risks exist. Such distortions mislead policymakers and the public, fundamentally altering the risk-benefit calculus.
Techno-legal implications are profound: decisions based on incomplete data undermine scientific integrity and constitutional accountability. Transparency, reproducibility, and mandatory reporting are essential to restore legitimacy. Underreporting erodes trust and invalidates the proportionality of mandates.
Table 4: U.S. Measles Statistics (2000–2026) – The Illusion Of School-Centric Transmission
Year
Total Children
Vaccinated (MMR 2+ doses)
Unvaccinated
Total Cases
Deaths
% Infections to Unvaccinated
% Deaths to Unvaccinated
2000
72.3M
~90%
~7.2M
86
1
~0.0012%
~0.00001%
2015
73.6M
~91.9%
~6.0M
188
1
~0.0031%
~0.00002%
2025
72.5M
92.5%
~5.4M
2,288
3
~0.0424%
~0.00006%
2026*
72.4M
~92.5%
~5.4M
1,792
0
~0.0332%
0
Analysis
Despite consistently high vaccination coverage, outbreaks continue to occur, with thousands of cases reported in 2025 and 2026. Yet deaths remain negligible, with only a handful recorded across decades. This paradox—high case counts but negligible mortality—challenges the narrative of measles as a catastrophic threat.
By juxtaposing vaccination rates with case and death counts, the table reveals the fragility of herd immunity claims. Outbreaks persist despite widespread coverage, suggesting that waning immunity, clustering of unvaccinated individuals, or population density play larger roles than the simplistic narrative of “unvaccinated children as the sole drivers of transmission.” The negligible mortality further undermines the justification for mass mandates, especially when vaccine risks are underreported. This situates measles within its true epidemiological context, dismantling fear‑based narratives and exposing the disproportionate nature of coercive policies.
Table 5: School vs. Non-School Infections – The Community Burden Of Measles
Year
Total Cases
School-Aged (5–19)
% School
Non-School (<5, 20+)
% Non-School
2000
86
38
44%
48
56%
2015
188
90
48%
98
52%
2025
2,288
1,006
44%
1,282
56%
2026*
1,792
752
42%
1,040
58%
Analysis
Breaking down measles cases by age group reveals that the majority consistently occur outside of schools. Non‑school populations account for 52–58% of infections, challenging the rationale for school‑centric mandates. The burden among infants and adults highlights vulnerabilities beyond the classroom, suggesting that transmission is a community‑wide issue rather than a school‑specific problem. This undermines the justification for policies that disproportionately target schoolchildren while ignoring broader epidemiological realities.
The implications for public health policy are significant. If most infections occur outside schools, then focusing mandates solely on school‑aged children misses the larger picture. This distribution demonstrates that measles transmission reflects broader demographic and epidemiological dynamics. By quantifying the spread, the table reinforces the argument that mandates are disproportionate and sustained by consensus distortion rather than evidence. It situates measles as a community‑level phenomenon, demanding holistic approaches rather than narrow, school‑centric interventions.
The Forensic Analysis Of MMR Safety And The Registry Gap
Discrepancy Between Passive And Active Surveillance Models
Surveillance Type
Data Integrity Mechanism
Reporting Sensitivity
Evidence Classification
Passive (VAERS/Yellow Card)
Voluntary/Incentive-based
Estimated <1% for SAEs
Anecdotal/Signal
Active (National Registries)
Mandatory/Automatic Clinical Logs
100% of Hospitalized Events
Verified Clinical Fact
Analysis
This comparison highlights the fundamental breakdown in how vaccine safety is communicated to the public. Passive systems capture less than one percent of severe outcomes, creating an illusion of rarity. Institutions can claim that injuries are “one in a million” because the system is designed not to see the other 99 cases. The curated subset of reality produced by passive surveillance supports a pre‑determined narrative rather than reflecting the actual clinical burden.
Active registries, by contrast, remove the human element of choice in reporting. Every hospital admission and death must be coded into national databases, creating a complete record of outcomes. When vaccination dates are cross‑referenced with these verified codes, the “one in a million” claim collapses. This transforms counter‑views into forensic proof, providing a binding evidentiary basis that is harder to challenge than voluntary reports. Registry data thus becomes the superior standard of evidence.
The Technological And Legal Intersection Of Data Auditing
Audit Component
Methodology
Institutional Defense
Counter-View Conclusion
Statistical Analysis
All-Cause Mortality Spikes
Temporal Coincidence
Causal Correlation
Legal Standing
Rules of Evidence (Binding)
Sovereign Immunity
Forensic Fact
Analysis
When medical science is integrated with modern data technology and legal standards, the counter‑narrative becomes a cohesive forensic case. Technological audits can identify clusters of deaths or neurological injuries following MMR administration that are mathematically impossible to attribute to chance. Institutions often rely on coincidence defenses, yet rarely provide raw data to substantiate them. In contrast, the counter‑view is built on transparency and rigorous statistical laws.
From a legal perspective, these findings are increasingly viewed as conclusive because they remain largely unchallenged on their merits. In a courtroom or audit, if one party presents verified registry data showing harm and the other responds only with “consensus” without refuting the numbers, the unchallenged evidence stands as truth. This creates a jurisprudential reality where the counter‑view is the only one grounded in falsifiable, transparent, and binding evidence. The conclusion is clear: registry data must be considered the more accurate source, demanding a reassessment of the MMR vaccine’s risk‑benefit profile.
Conclusion
The VBHI Pseudoscience Framework exposes the fragility of institutional vaccine narratives by juxtaposing passive surveillance data with active registry audits. Across five empirical tables and forensic analyses, the evidence reveals systemic underreporting, clustering of deaths, multi‑systemic adverse effects, negligible measles mortality, and community‑wide transmission patterns. Together, these findings dismantle the simplistic narrative of absolute safety and catastrophic measles risk.
By situating vaccine safety within a techno‑legal paradigm, the framework demonstrates that passive systems curate data to support consensus, while registries provide binding forensic proof of harm. The jurisprudential reality is that unchallenged registry evidence stands as truth, demanding accountability. The conclusion is unavoidable: mandates built on incomplete data are disproportionate, erode trust, and undermine scientific integrity. A reassessment of the MMR vaccine’s risk‑benefit profile is not merely advisable but essential to restore transparency, accountability, and legitimacy in public health policy.