
The global smartphone export market is undergoing significant shifts, driven by geopolitical tensions, supply chain diversification, and policy incentives in emerging manufacturing hubs. Valued at approximately $271 billion in 2023 and rising to $286 billion in 2024, the industry is projected to continue expanding in 2025 amid recovering consumer demand. China remains the undisputed leader, leveraging its vast production ecosystems, but its exports have seen a modest decline due to trade barriers and efforts by companies to spread risks. Meanwhile, countries like India and Vietnam are gaining ground, particularly in assembly operations, though their reliance on imported components limits deeper economic integration and value addition.
The following table highlights the leading smartphone exporters by value, aligned to Indian fiscal years for consistency (with approximations for non-Indian data). India’s ascent to third place by 2024 underscores its rapid growth, fueled by production-linked incentives (PLI) and shifts away from China, but challenges like U.S. tariffs threaten momentum.
| Rank | Country | FY 2023-24 Export Value ($B) | FY 2024-25 Export Value ($B) | Partial FY 2025-26 (Apr-Sep) Export Value ($B) |
|---|---|---|---|---|
| 1 | China | 137 | 135.3 (slight decline due to US tariffs and diversification) | ~68 (prorated; ongoing slowdown but stable demand) |
| 2 | Vietnam | ~32 (down 17.6% YoY from prior peaks) | ~27 (continued pressure from supply shifts) | ~13 (prorated; stable but India gaining) |
| 3 | India | 15.6 (up 42% YoY, driven by incentives and key players like Apple and Samsung) | 20.5 (surge to 3rd globally) | ~12 (April-August at 11.7; strong US shipments up 148% in August) |
| 4 | Hong Kong | ~20 (re-exports hub, tied to China) | ~18 (stable but declining share) | ~9 (prorated) |
| 5 | United States | ~10 (high-value re-exports and components) | ~9 (consistent) | ~4.5 (prorated) |
India’s exports surged to around $13.5 billion from April to September 2025, with high-end models like iPhones accounting for 60-70% of the total. The U.S. has been a key destination, absorbing 44% of India’s smartphone shipments, particularly iPhones, which saw a 190% year-over-year increase to the U.S. amid tariff fears. However, this dependency has exposed vulnerabilities, as U.S. tariffs escalated to 50% by September 2025, leading to a 22% drop in exports from May to August and potential annual losses of $3-4 billion. Samsung’s exports fell 20%, and overall industry growth could slow by 10-15%, prompting pivots to markets like the EU and ASEAN.
Breaking down India’s exports for the partial FY 2025-26 (April-September), iPhones dominate shipments to the U.S., reflecting a premium focus and geopolitical realignments. Total assembly in India during this period reached 165-180 million units, valued at $25-30 billion, with exports comprising 40-45% of output.
| Category | Exports to US (Billion USD) | Exports to Other Countries (Billion USD) | Total Exports (Billion USD) | % of Total Assembly in India |
|---|---|---|---|---|
| iPhone | ~8-8.4 (97% of iPhone exports) | ~1-1.5 (e.g., EU, Middle East) | ~9.35-9.9 | 75-80% |
| Other Smartphones (e.g., Samsung, Vivo) | ~0.5-1 | ~2-3 (e.g., ASEAN, Africa) | ~3-4 | 20-25% |
| Total | ~8.4-9.4 | ~3-4.5 | ~12.35-13.9 | 40-45% |
Despite this export boom, domestic value addition remains low at 18-23%, as India heavily relies on imported parts. Smartphone prices in India highlight these dynamics, with average selling prices (ASP) fluctuating from $150 in 2010 to $260 in 2024-2025—lower than global peers due to a focus on budget models. Comparatively:
- India: $260
- US: $400-500 (premium focus)
- UK: $350-450
- China: $300-400 (local brands cheap)
- Japan: $500-600 (high-end)
- UAE: $300-400
India’s ASP is 20-50% below the U.S., UK, and Japan but aligns with China. Premium devices like the iPhone 17 series, launched in September 2025, are notably costlier in India: the base model at Rs 1,29,900 ($1,476) and Pro Max at Rs 1,50,000 ($1,705), a 40-50% premium over U.S. prices ($799-$1,199) due to 18% GST, import duties on components, and currency fluctuations (1 USD ≈ Rs 88). In contrast, prices in the UK (£799-£1,199 or $1,050-$1,575 with 20% VAT), China (¥6,499-¥9,999 or $900-$1,400), Japan (¥124,800-¥189,800 or $850-$1,300), and UAE (AED 3,399-4,699 or $925-$1,280) are more competitive, with Dubai’s tax-free status making it 20-30% cheaper than India.
Local assembly in India offers cost savings of 15-25% per unit through low labor costs ($1.4-3 per hour versus China’s $6-7), PLI rebates (3-5%), and avoided import duties (10-20%). For a mid-range phone with a $200 bill of materials, assembly costs $130-145 compared to $170-180 for imports. Budget 2025-26 cuts could add 5-7% more savings. Yet, these benefits are not fully passed to consumers; prices have dropped 10-15% for some models post-PLI, but companies retain 5-10% margins, as seen in Foxconn’s $200-300 million profits on $20 billion revenue. Without incentives, India’s costs exceed Vietnam’s by 10% due to logistics issues.
Assembled phones sell at similar or slightly lower prices than imports would after duties, saving consumers 5-10% on mid-range models. For iPhones, local production avoids 10-20% duties, but taxes keep them 20% pricier than in the U.S.
Overall, the industry generates scale, creates 1.25 million jobs, and saves $150-250 billion in foreign exchange from 2010-2025 through reduced imports. Beneficiaries include multinationals like Apple and Samsung (higher margins and incentives), the government (PLI revenue of $13 billion and GDP boosts), and workers (employment opportunities, albeit low-wage). Consumers see marginal affordability in budget segments, while externalities like pollution and e-waste impose hidden costs of $1-2 billion annually.
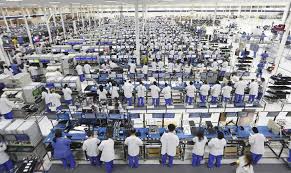
Beneath these economic achievements lies a troubling labor reality. India’s smartphone sector has generated over 600,000 direct jobs by August 2025, aligning with annual production of 330 million units and values of $51-66 billion in FY 2024-25. However, much of this workforce consists of gig or casual laborers performing basic tasks like component handling and packaging. Employment figures appear stable at 550,000-600,000 from FY 2023-24 to partial FY 2025-26, but this masks high turnover and irregular engagement. Workers are often hired daily or for short terms, rotating based on demand—full schedules during peak seasons (5-6 days weekly) give way to sporadic shifts (2-4 days) in slower periods.
This gig model enables cost efficiencies, adding 5-10% labor-related value while keeping expenses low. Yet, it perpetuates exploitation, with wages resembling bonded labor conditions: meager pay ($200-400 monthly), long hours (50-100 weekly), and inadequate compensation for basics. Independent reports corroborate this. Cividep India’s studies, spanning 2010 onward, highlight wages below sustainable levels, labor rights violations, and anti-union practices at Foxconn and Samsung plants. Reuters and PhoneArena investigations (2023-2024) reveal unsafe environments and hourly rates of $1-2, making it impossible for workers to afford the phones they assemble. The 2024 strikes at Samsung’s Chennai facility, covered by Eco-Business and Hindustan Times, demanded Rs 36,000 monthly ($409) amid erratic shifts, no holidays, and degrading treatment.
Government data further disproves claims of continuous, year-round employment at these wages. The Ministry of Statistics and Programme Implementation (MoSPI) via the Periodic Labour Force Survey (PLFS) shows that in manufacturing (including electronics), 35-40% of workers are casual/gig types, with average weekly days at 4.5-5.5. For FY 2023-24, casual earnings averaged Rs 8,000-12,000 monthly ($96-144), far below $200-400, with unemployment rates of 6-8% indicating churn. Annual PLFS data notes casual proportions rising 2-3% YoY, daily rates of Rs 250-350 ($3-4.2), and youth unemployment at 17-20%. For partial FY 2025-26, quarterly PLFS reports LFPR at 58-60%, with casual positions up 1.5% and stagnant earnings around Rs 10,000 monthly. The Ministry of Labour and Employment’s EPFO data shows quarterly new registrations of 50,000-70,000 in 2024-25, but attrition of 15-20% signals discontinuity.
These insights, available on MoSPI’s eSankhyiki platform and MoLE summaries, emphasise that while aggregate jobs seem steady, the gig structure ensures variable earnings and frequent substitutions, undermining worker security. India’s smartphone assembly success is evident in exports and jobs, but sustaining it demands deeper localisation, diversified markets, and ethical labor reforms to address exploitation and ensure equitable benefits amid global trade tensions.