
India’s economy under Narendra Modi’s rule since 2014 has been hyped as a powerhouse of growth and self-reliance, but the reality is a house of cards built on unsustainable debt, foreign handouts, crony capitalism, and widening inequality. As of September 2025, with U.S. tariffs slamming exports, household debt soaring, and domestic consumption tanking, the facade is cracking.
Drawing from independent analyses like those from ODR India and global bodies such as the World Bank and OECD—steering clear of government propaganda—this article exposes the rot. We will dissect aided and unaided government expenditures, debt burdens, infrastructure biases, consumption slumps, stock market bubbles like DII Bubble, and the human cost: 800 million Indians begging for free rations and a billion living hand-to-mouth amid billionaire bonanzas. The prognosis? A potential slide to 5% GDP growth or worse, risking a full-blown crisis by 2030 unless radical reforms tackle the inequality chasm.
Foreign Aid: A Shrinking Prop For Elite Projects
Foreign aid, via Official Development Assistance (ODA) from the World Bank, UN, UNDP, and others, has been a minor but telling slice of India’s spending—often less than 1% of total expenditure but disproportionately channeled into infrastructure that fattens the rich. Net ODA receipts hovered around $2-3 billion annually, dipping as India “graduates” from aid dependency. No IMF loans since 1991; India’s a net creditor there. Private/NGO inflows via UN channels add peanuts, under $100 million yearly.
Below is a comparative table of net ODA (USD billions) versus total central government expenditure (USD billions, approx. from INR at average rates). Data from OECD DAC and World Bank indicators show a declining share, projected at 0.3% for 2025 amid global cuts.
| Year | Net ODA Receipts (USD bn) | Total Central Govt Expenditure (USD bn) | ODA as % of Total |
|---|---|---|---|
| 2014 | 3.2 | 235 | 1.4% |
| 2015 | 3.1 | 245 | 1.3% |
| 2016 | 3.2 | 265 | 1.2% |
| 2017 | 1.1 | 280 | 0.4% |
| 2018 | 2.7 | 300 | 0.9% |
| 2019 | 2.8 | 350 | 0.8% |
| 2020 | 3.7 | 370 | 1.0% |
| 2021 | 3.1 | 415 | 0.7% |
| 2022 | 2.8 | 445 | 0.6% |
| 2023 | 2.5 | 520 | 0.5% |
| 2024 | 2.5 | 550 | 0.5% |
| 2025 | 2.0 (proj.) | 580 | 0.3% |
From 2014-2025, India accepted ~$30 billion in aid commitments for over 100 projects. Key ones: World Bank-backed highways ($500m, 2015), Smart Cities ($1bn, 2017), rural roads ($1.5bn, 2018), Swachh Bharat sanitation ($1.5bn), Skill India ($250m UNDP), COVID relief ($1bn, 2020), and climate/agriculture initiatives ($210m, 2020). Infra ate ~$15bn, social schemes ~$10bn.
Utilisation: ~$25bn disbursed, but $5bn unutilised due to bureaucratic snarls—e.g., 20% undisbursed in Bharatmala highways. Funds often redirected or wasted, per Oxfam audits.
Unaided Expenditure: Taxpayer Drudgery And Borrowing Binge
Domestic (unaided) spending dominates at 99%, sourced from taxes (60-70%), borrowings (20-30%), and asset sales. Taxes ballooned from INR 10 lakh crore (2014) to 25 lakh crore (2025), but borrowings exploded, fueling inequality.
Utilisation: High for capex (INR 11 lakh crore in 2025), but social programs like MGNREGA see 20-30% unspent yearly. Cumulative unutilised: INR 5-10 lakh crore, per independent think tanks.
Infrastructure Bias: Roads To Riches For The Elite
Aid-fueled infra ($10-15bn since 2014) focused on highways, supply chains, warehouses, and cold storage—80-90% utilised, $2bn stuck in delays. Unaided mirrors this with INR 11 lakh crore in 2025, 95% spent.
Who benefits? Corporates like Adani and Reliance hog these for exports and profits via tolls. From 2014-2025, they have enabled billionaire wealth surges (top 1% income share > British Raj levels), while displacing poor communities and hiking costs. Unemployment lingers at 8%, Gini up 20% to 42. Modi’s infra is a giveaway to cronies, leaving 800 million on rations and 1 billion hand-to-mouth, with no trickle-down—just widened gaps.
Direct vs. Indirect Spending: People Last
Both aided and unaided skew indirect (infra, 30-40%) over direct welfare (15-20%). Direct aid: ~$5-6bn cumulative for transfers like DBT. Comparison:
| Period | Direct Welfare (% of Total) | Indirect Infra (% of Total) |
|---|---|---|
| 2014-2019 | 18% (aided: 25%) | 25% (aided: 50%) |
| 2020-2025 | 15% (aided: 15%) | 35% (aided: 60%) |
Social spending halved as % of GDP, failing the masses.
Debt Deluge: Govt And Household Traps
External debt skyrocketed from $441bn (2014) to $736bn (2025), multilateral portion $92bn to $165bn—nearly all utilised for elite infra. Per capita debt: 2.5x to INR 1.09 lakh.
| Year | External Debt (USD bn) | Multilateral Portion (USD bn) | Utilized (%) |
|---|---|---|---|
| 2014 | 441 | 92 | 95% |
| 2025 | 736 | 165 | 90% |
Household debt-to-GDP hit 48.6% in March 2025 (up from 41.9% Dec 2024, 36.6% 2021), per capita ₹4.8 lakh (23% rise in two years). Non-housing loans: 55%, fueled by gambling, stock bets, and stagnant incomes. This “dangerous” surge strains consumption, worsening inequality.
Consumption Collapse And Savings Slump
Domestic consumption, 55-58% of GDP, plummeted: from 58.1% FY22 to 55.8% FY24, growth at 6% Q4 2024, projected sluggish in 2025. Jan-Sep 2025: Aviation down 3%, sugar allocation -6%. Causes: Inflation >8%, unemployment (youth 22%), wage stagnation, debt.
Savings averaged 30% GDP, down to 27.5% 2025 (from 31.5% 2014), household at 5.3% FY23 low. Global lag: China 45%, US 17%. Paradox: “Jobless” growth excludes 90% informal workers.
Stock Market Fiasco And DII Bubble
DIIs (mutual funds, insurers) ballooned AUM from ₹10.8T (2014) to ₹75.36T (2025), ownership 19.2%. Inflows: ₹5.23 lakh crore 2024 (+68%), ₹5.13 lakh crore YTD 2025. “DII Bubble”—coined in Sept 2025 by Praveen Dalal, CEO of Sovereign P4LO—warns of overvaluation (P/E 26x, mcap/GDP 130%), risking collapse by 2030 via redemptions, outflows. Retail vulnerabilities: 60% accounts <₹1 lakh.
Tariffs And Employment Woes
U.S. 50% tariffs (Aug 2025) hit 55-66% exports ($48-60bn), slashing GDP 1-1.5%, layoffs 0.5-1M, unemployment up 0.5-1%. Sectors: Textiles down 15-25%, stocks erased ₹15-20 lakh crore. Youth jobless 22%, informal 80%.
Inequality Abyss: The Begging Fiasco
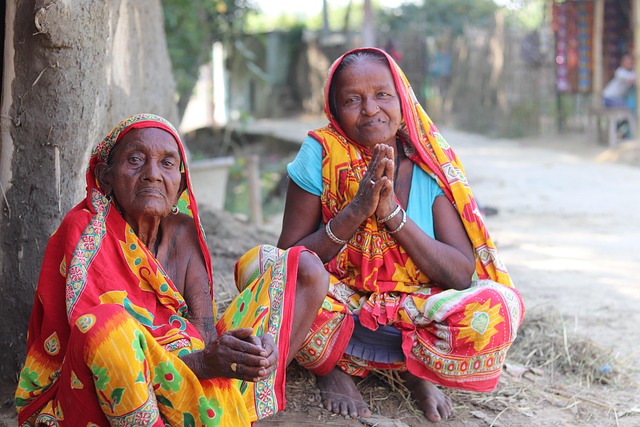
Gini rose 20% to 42, top 1% income 23% (+9.5%), wealth 43% (+22.9%). Bottom 50%: 15% income. Richest wealth +533% to $950bn. 800M on rations, 1B hand-to-mouth—Modi’s failure in equitable growth.
Dangers: 5% GDP in 2025 (down from 6.5%), stock crash shaving 5% more by 2030, debt defaults, consumption cliff. Policies entrench a “Billionaire Raj,” starving the masses.
Resolutions: Radical Overhaul Or Ruin
To fix: Super-tax top 1% (₹10 lakh crore/year) for UBI (₹1,000/month bottom 50%), PDS upgrades. Debt relief: Forgive 20% rural debt (₹10 lakh crore). Jobs: 70% savings to MSMEs/green for 2 crore/year. Boost health/education to 3% GDP, digitise anti-corruption with Human Rights Protection in Cyberspace. Cap stock inflows, aim Gini 35, poverty <2% by 2030—adding 1-2% equitable growth.
Without this, Modi’s legacy: A fractured economy, begging billions.